Unified pricing analytics for global app stores
Unify App Store, Google Play, and web data into one workspace that shows how your prices move, convert, and grow over time.
Make pricing performance measurable
Before Mirava
- Each platform reports differently, so nobody is fully sure which numbers to trust.
- Revenue blips show up in the dashboard, but the “why” stays in side-docs and people’s memory.
- Any pricing question (“what happened in Brazil last month?”) turns into another one-off export.
After Mirava
- App Store, Google Play, and web data land in one place, structured around your products and plans.
- Every price change, promo, and experiment is logged next to the metrics it impacted.
- Product, growth, and finance can all answer “what changed?” from the same analytics view.
Turn pricing from gut feel into numbers
Connect your data
Connect with App Store, Google Play, and (optionally) Stripe or your web backend. Mirava keeps products, price tiers, and subscriptions in sync so analytics stay aligned with what’s live.
Tag pricing events
Mark price updates, FX changes, promos, and tests as events without rebuilding your reports. Mirava stores them on a clean timeline so you can always rewind and see what changed.
Read trends
Explore plans, regions, and storefronts to see how revenue, ARPPU, and conversion move around each change, instead of scrolling through raw logs or static exports.
Give pricing decisions real data behind them
See the full picture
Revenue, subscriptions, and installs roll up across platforms, but you can always break them back down by app, plan, and country.
Isolate the effect of changes
Overlay events like price rises, discounts, and FX updates on your metrics so you can see which moves actually shifted the curve.
Compare markets properly
View performance by region with PPP and currency context, not just raw dollar totals that punish lower-income markets.
Share numbers people trust
Give product, growth, and finance a single source of truth instead of everyone maintaining their own spreadsheet version.
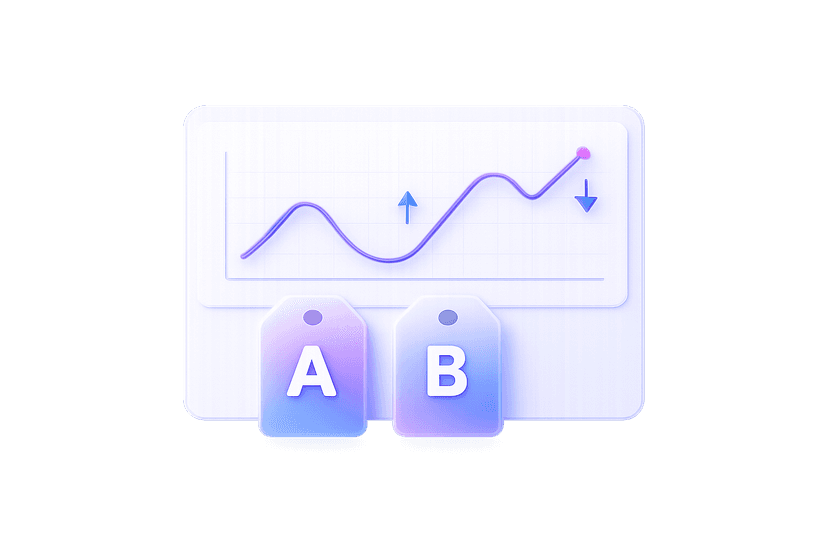
Monitoring price tests
Track how test prices perform by storefront, country, and plan. See lift or drop against your baseline instead of guessing from one metric.

Understanding regional performance
Spot where revenue is growing but conversion is flat, or where cheaper regions quietly carry volume. Decide what to do with context, not hunches.

Reviewing legacy plans
Identify old SKUs and grandfathered plans that drag on ARPPU. See how much they contribute today before you migrate or retire them.
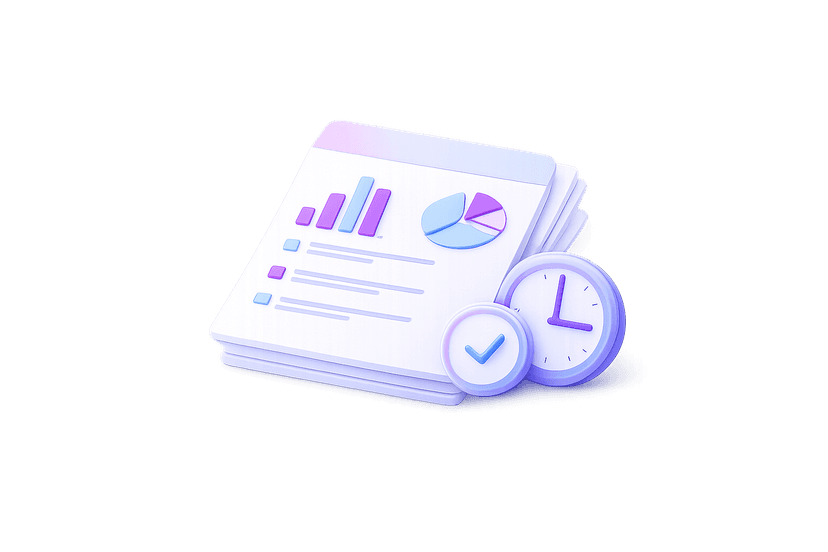
Simple Reporting
Pull clean numbers for board decks, investor updates, and pricing reviews in minutes, without re-building pivot tables every time.
Frequently asked questions
Which data sources can Mirava connect to for pricing analytics?
Right now: App Store, Google Play, and Stripe or a web subscription backend. If your stack is different, we’ll help you understand how to connect it or whether we’re a fit.
Do we need a data team to use this?
No. Mirava sits between your stores and your team. Set up connections once, then most of the work is choosing views and tagging pricing events — the model and joins are handled for you.
Can Mirava replace our existing BI dashboards?
It can replace all the pricing-specific dashboards that keep breaking whenever tiers or SKUs change. For broader analytics, Mirava usually sits alongside your main BI tool.
How reliable is the data?
Mirava keeps data in sync on a schedule that makes sense for pricing work — typically multiple times per day, with more frequent updates during active experiments or big changes.
What happens if we change our catalog structure?
When you add new plans, retire old ones, or reorganize products, Mirava keeps historical data mapped so you can still compare past and present without losing continuity
Is this overkill for a small app?
If you’re running a single SKU in one country, probably. Once you have multiple apps, plans, or regions, the time saved and clarity gained usually outweigh the cost very quickly.
Smarter pricing without the spreadsheet hangover
Connect your stores once, set your rules, and run the next price change across App Store, Google Play, and web in one pass.