Picking the right price for your app can make or break how much money you make. Try out various prices to see what suits best in different places and for different people. Here’s a short plan on how to test prices well:
- Have clear goals: Make goals you can check, like making 10% more money from each user.
- Split users on chance: Make sure the results are fair by putting users into test and control groups.
- Stick to one change: Just change the price and keep all else the same.
- Watch key numbers: Keep an eye on how many buy, average money from each user, and how many leave.
- Fix your data: Get rid of mistakes, use the same formats, and make sure it’s all there for good checks.
- Use local prices: Set prices as per how much people can spend in different countries to earn more.
Testing prices isn’t just for fast wins. It’s to know how people act and to plan for the long run. Tools like Mirava make it easy to change prices everywhere, watch data, and test A or B, helping you choose well without trouble.
Want to know how to use raw numbers to make good price plans? Let’s jump in.
A/B Price Testing for Mobile Apps
Setting Up Price Tests
The heart of any good price study is in well-made tests. Without a strong set-up, your findings may be off, and your insights could mislead you. A solid test helps in collecting useful data.
Making Clear Goals and Metrics
Start with a concrete plan before changing any prices. Stay away from unclear ideas like "let's see what happens if we push up prices." Instead, aim for clear goals: "If we lift our monthly fee from $4.99 to $5.99, money per user will go up by 10% because users will see more worth." This focus makes sure your test is on point.
Keep an eye on how many buy and money per user to check short and long results. Don’t miss out on watching how many stay - it's key to keep making money over time.
Set a smallest big effect before testing, usually between 5% and 15%[3]. This helps you look at big changes that are worth the work and possible risks. For example, a 2% money rise might not be worth the chance of making customers unhappy.
Look at other key metrics too. Watch things like how many ask for help, app store reviews, and how many leave. A price jump might raise money at first but could hurt your brand if customers feel pushed away. Clear goals and the right metrics mean your test results help make smart price choices.
Splitting Users and Randomly Picking
Random picking is key for true results. Split users by account or device not by where they come from or how often they visit. This stops bias from twisting your data. For instance, users from paid ads might act different than those who find your app on their own.
A simple 50/50 split is good for most tests[4]. Put half your users on the old price (control group) and the other half on the new price (test group). Check both groups are alike in where they live, how they act, and where they are from before starting.
Think about area-based splits for deeper looks. In June 2023, a mobile app tested three prices - $3.99, $5.99, and $9.99 - in the US, Brazil, and Switzerland. The results? Best money was at $5.99 in the US, $6.99 in Switzerland, and $3.99 in Brazil. This local method led to a 17% money jump through fitting price plans[2].
Write down everything - group sizes, usual habits, and time-based trends. Good planning makes sure your test setting stays fixed and your results are trustworthy.
Testing One Thing at a Time
Focus only on the price. Keep all else - the design, how users start, marketing - the same. Changing too many things at once may mix up your results, leaving you unsure if price was the real cause of change.
Make sure all app parts are the same between test groups[3]. Run your test for weeks to see how users act and to get sure results.
Platforms like Google Play stress the need to wait for sure results before choosing based on your findings[4]. Be patient - let your test run long enough to collect clear data.
When your tests are set up right and done well, you'll be set to jump into sorting and looking at data for more clear views.
Fixing and Polishing Test Info
Before you can trust what you learn from test prices, you need to clean the basic info. Good preparation of data is key to making sure your findings are right and helps stop big mistakes. The first move is to check that your data is full and can be used.
Looking at Data Quality and Fullness
Start by getting data from every place involved in your test. This could be app stores, analytic tools, or payment setups. Ready yourself to face info that has different looks or is missing some parts.
Be sure to look after gaps in important info like prices, rate of buys, money made, and user groups. For example, if a few days of money info are missing from your test group during the test, that's a big problem. Check again to see all needed info is there.
Also, watch out for mistakes or wrong values. Some mistakes are rates of buys over 100%, prices that are less than zero, or money totals that seem too high. Use automatic checks or validation tools to spot these odd things for more checks.
If you see holes or mistakes in the data that can't be fixed, write them down well. Think over if you should guess the missing data or leave it out, and be sure to note why you choose what you do.
Making Data Even for True Comparison
To compare fairly, change all money values to U.S. dollars with the same rate of exchange. If your test went through many countries, use one rate from the test's beginning and use it for all. Write prices like $9.99 or $29.99 so they match U.S. ways.
Make sure time marks are set to one time zone, best if it's U.S. Eastern Time, and write dates in the MM/DD/YYYY style. This stops mix-ups when handling data from many places.
Even out measures, like money per 1,000 users, to match different group sizes. Without this step, bigger groups could tilt results, making comparisons not fair.
Old rates of exchange can throw off buys across a wide range of markets. Properly making info even not only shows these things but also lets you fix them before they hurt your business. With your data even, you can start to pinpoint extreme bits and check if your group size is big enough for good findings.
Handling Extreme Bits and Group Size
Extremes can twist your results, so flag odd numbers using ways like z-scores or distance between quarters. For instance, a single user who spends $500 when most spend $5 can make a test group look much richer than it really is.
Be sure your group size is big enough to spot real changes. For instance, if you want to see a 2% shift in a 10% buy rate, you’ll need thousands of users in each group. Small groups can give results you can't trust, which could lead you wrong in how you set prices.
First, work out the smallest number of samples you need for a sure 95% trust level. Power tools will show how many users to get. Not enough data can mean your findings are just chance.
Keep your raw and cleaned datasets tidy and apart. Name files well, like "pricing_test_raw_data" and "pricing_test_cleaned_data", so it’s easy to find the first data later. Make a data list to explain each part and write down all you do to clean it.
Use of sites like Mirava can make things easy. They line up pricing data by place, change money to U.S. dollars, and spot odd things or big changes. This cuts down errors and saves time when cleaning.
With clear and ready data, you can start to look at it and find patterns that help set your prices.
Spotting Trends in Your Data
Once your data is good to go, it's time to dive deep into it. The aim? Pull out useful insights that help guide your pricing plans. To do this, keep an eye on important metrics, test for real stats strength, and weigh the pros and cons of various prices. This will clear the way to make pricing choices based on these trends.
Checking Vital Performance Metrics
Three main metrics show how pricing shifts your business: conversion rate, average revenue per user (ARPU), and churn rate. These metrics together give a full view, mixing user joining, money made, and user staying.
- Conversion rate: This tells you the share of users who end up buying. For example, seeing conversion rates at $4.99 versus $7.99 can show how price tweaks shift buying action.
- ARPU: This metric tells you how much money each user brings in on average. Higher prices might cut the number of buyers but could mean more money made per user. For instance, at $5.99, you may find a 12% conversion rate with a $2.50 ARPU, while at $7.99, the rate might drop to 9%, but ARPU could rise to $2.80.
- Churn rate: This follows how many users leave your app after a price shift. While higher prices might lift income short term, a high churn could hurt growth later.
Watch these metrics every week during your test phase. Trends over time can show if early gains hold up or if downsides crop up later.
Using Stats Tests to Check Groups
When looking at results, it's easy to read too much into early differences. Stats tests make sure the shifts you see are true and not just by chance.
- T-tests: These are perfect for comparing two prices. A p-value under 0.05 means the difference is real and not just happenstance.
- ANOVA: If you're checking more than two prices, ANOVA is your best bet. It checks several groups at once to find noteworthy differences.
For any test, you need enough data. Aiming for a change size of 5–15% helps you focus on changes that truly affect your business. Writing down your stats methods before you start also keeps interpretations fair later.
Making Tables to Show Trade-offs
Tables are a strong way to see trade-offs across different metrics. They help you weigh and share your findings.
| Cost | Change Rate | Avg Pay | Leave Rate | All Money |
|---|---|---|---|---|
| $4.99 | 12.0% | $2.50 | 7.0% | $3,000 |
| $7.99 | 9.0% | $2.80 | 6.5% | $2,520 |
| $9.99 | 7.5% | $3.10 | 8.2% | $2,325 |
This table shows a big pricing problem. The lowest price brings in the most cash and sales, while the middle price does well by keeping more money per user and losing fewer of them. The highest price does not do so good, which may mean it's too much for what your buyers want to pay.
To look deeper, split the data by groups like new or old users, areas, or ways they found you. Area prices, for instance, can show how some places deal with high prices better than others.
Sites like Mirava make this easier with tools that watch sales and cash in many places and ways. You don't have to make charts by hand. You can see how prices are doing fast in each area. This finds where a single world price is harming sales in areas that don't like high prices.
Use these charts and thoughts as a start for talks on how to mix quick cash with keeping people for a long time. They also help see if the same price everywhere works or if it's better to change prices for different places. This work helps you turn data into smart price choices.
sbb-itb-43fe43a
Turning Test Data into Pricing Choices
Test data on prices matters most when it helps boost sales. The hard part is not just looking at numbers, but making smart pricing choices for each place and type of buyer. What's the plan? Set up a pricing method that fits with the real buying habits of your app users all around the world.
Changing Prices Based on Place
One price for all seldom works everywhere. A single world price often means fewer sales in most places. So, setting prices for each area is key.
First, look at how each place reacted to your test prices. For instance, if a $9.99 price worked well in the USA, but Brazil users liked $6.99 better, it’s clear changes are needed. Prices should match what people in each spot can pay to get the most sales.
Purchasing Power Parity (PPP) is a good way to set fair prices based on what people in different areas can spend. Apps that move to a PPP-based plan for their subscription tiers often see meaningful gains in global sales, because prices line up with what users in each market can actually afford. A well-executed PPP pricing strategy can be a real game-changer for subscription plans.
The hands-on way sets prices for each area after trying it out. Like, you may set your app's price at $9.99 in the US, $6.99 in Brazil, and $11.99 in Switzerland, making sure your prices fit what people can pay and meet your money goals.
Put these changes in place step by step. Keep a close eye on what users say and any help they need to fix any issues soon. Many teams know their pricing in emerging markets isn't right but lack the time or understanding to fix it. Rolling out country‑specific pricing quickly - rather than wrestling with manual updates - often brings churn down once prices better match local affordability.
When you set the right local prices, the next thing to do is set prices for each kind of buyer.
Changing Prices for Different Buyers
Once you deal with prices in each place, look at how to change prices for each kind of buyer. Your test info can show the ways of new users, old users, users who come on their own, and users you pay to get.
For new people, a low first price can work well. It makes it easy for them to start while still letting you make money later. Look at things like how many stay after a trial, how long they stay, their total worth, and how many leave to set the right price for each group. Checking groups over time is great for knowing how much money you can make later and making your plan better.
Write down which buyers like which prices best. Over time, this note will help you know what to do about prices later. For example, if users from some channels often have higher total worth, you might want higher prices for them.
Making a Plan for Prices in the Long Run
Short moves are key, but the big worth is in using what you learn for a long plan for prices. Use your test results to make a plan that changes with what the market does.
Look for things that happen over and over in your info. Some places might always like certain prices, and some kinds of buyers might act in ways you can guess. Use these hints to shape your whole way to set prices.
It's key to keep testing to stay in the game. Markets move, new rivals come, and what users want changes. Set times to check your prices - every three months for places or every month for new kinds of buyers - to make sure your plan stays fresh with the market.
Use old info to see what affects your main numbers the most. If setting local prices often makes more people buy, use that in your next tests. If certain prices bring in more money from some buyers, think about using those prices in your choices.
The big aim is to make a price plan that keeps up with market changes. Tools like Mirava make it easy by setting local prices within rules you pick, watching money in dashboards, and helping you read your price tests. This lets you focus on the big plan while the tool does the day-to-day work across iOS, Android, and web setups.
The shift is practical: many teams avoid touching pricing because it feels like too much work, but with the right tooling you can test new strategies without worrying about spreadsheets or App Store rules - which removes a major barrier to growth.
Using Mirava for Different Area Pricing

Once you sort out how well your price tests were and find out the best ways to set them, the next task is to make these changes in many lands and on different sites. Doing this by hand can be a bad dream - a lot of work with a big chance for mistakes. Here is where Mirava comes in. This tool makes the whole task easy with its auto setup and checks every moment. Here is how it helps set world prices in a better way.
Making Price Changes Easy Across Lands
After you have your price data, the real work is to put it in place well. Changing prices one by one on iOS, Android, and web spots in different lands can be too much. Mirava helps by making price changes auto for 175+ lands [2]. It deals with all from money changes to rules that each site needs, letting you set up changes in all lands and sites in just a few mins.
The site links right with app store setups and puts in local price rules once you say yes or within caps you set. For example, if your tests show that $9.99 is good in the U.S. but $6.99 is better in Brazil, Mirava will fix these prices while making sure they fit each site's price steps and tax needs. It also shows prices right for each area - U.S. people see "$9.99", while those in Europe see "€8.99", with the right dots and commas.
And no need to worry about changes in money value. If the U.S. dollar gets stronger against the euro, Mirava can fix European prices within the caps you set to keep your money intake the same. This stops the risk of asking for too little or too much that often comes with set price plans.
The Premium plan, priced at $49 per app per month, includes group price changes, making it a good choice for handling many things well. For bigger groups with more needs, the Enterprise plan gives custom price setups, and your own account boss.
Watching Money Changes with Dashboards
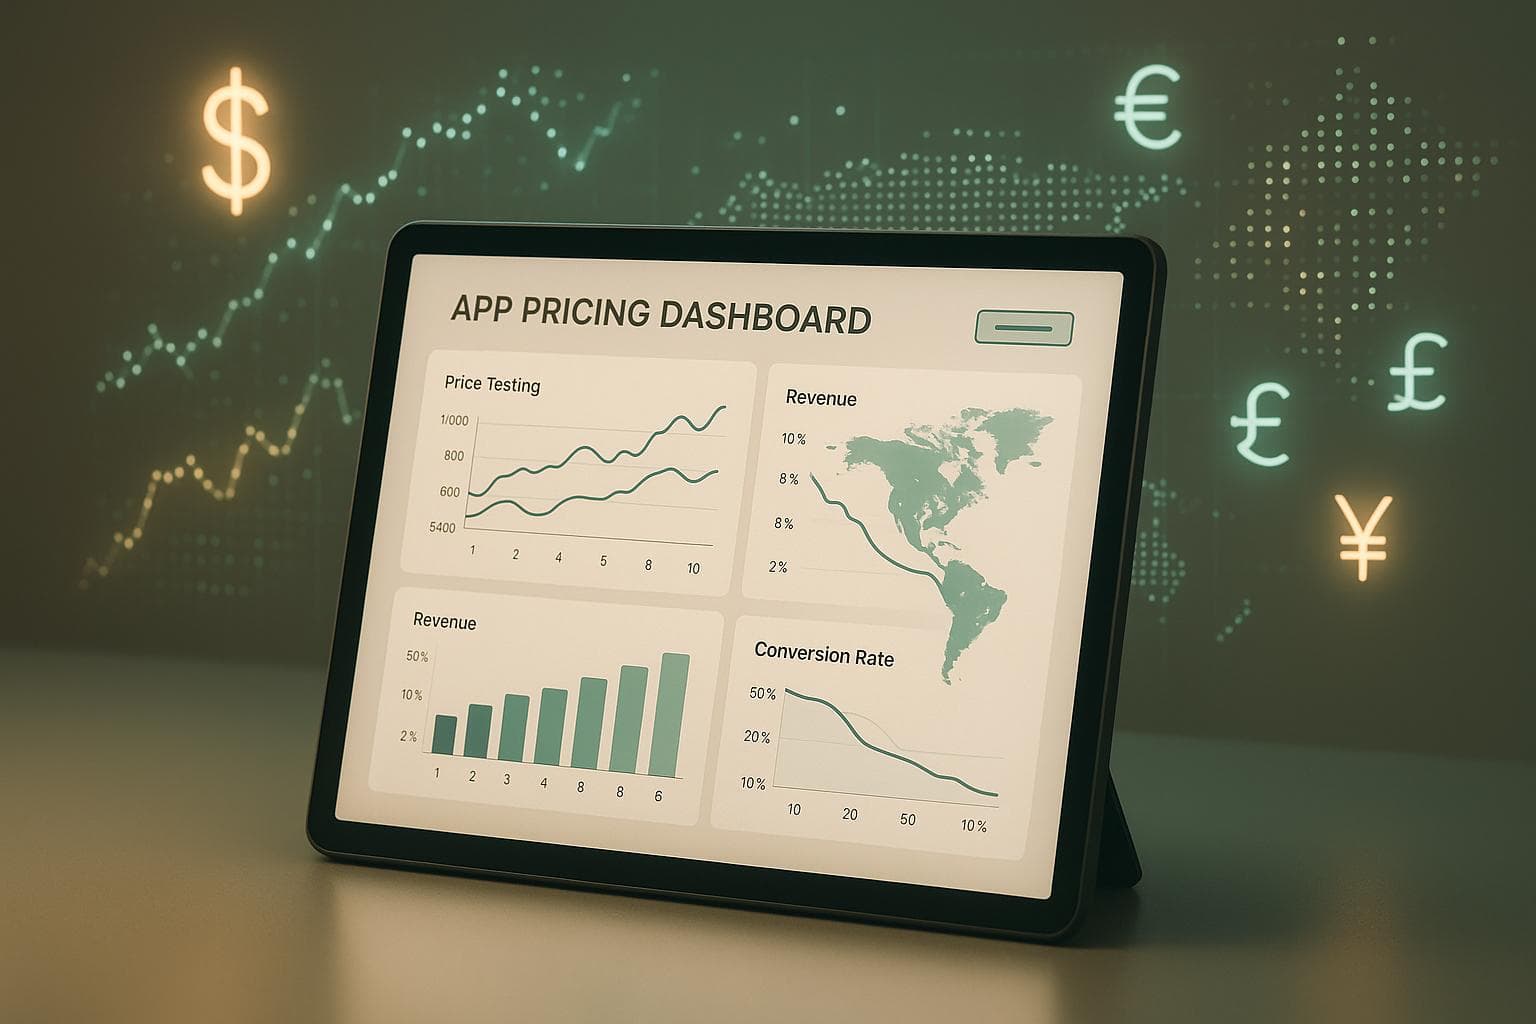
Putting in new prices is just step one - you also need to watch how these changes do. Mirava's one-view dashboard lets you see live money intake, rate of buys, and other main points, all split by land, site, and price type.
This dashboard puts info from iOS, Android, and Stripe in one spot. It tells you just what users pay, how those payments turn into buys, and where you might lose cash. For instance, if you raise prices in the U.S., you can check right away if money per person goes up without hurting buy rates. The view style makes it simple to see trends that might be missed in data sheets.
For Enterprise plan users, big info tools and more reports give deeper look-ins. These tools add group checks, helping you know how price changes affect how people act over time. You can also set alerts for big shifts in main points, so you catch both chances and problems early.
No more flipping between App Store Connect, Google Play Console, and Stripe. Mirava puts all this info into one easy system with the same look and time zone setups.
Where Mirava Fits
Mirava does not run A/B tests. Variant assignment, sample-size monitoring, and cohort tracking belong to your paywall and experimentation layer, such as RevenueCat or Adapty.
What Mirava answers is the question that comes before the test: what price is worth testing in each market. The Mirava Index shows what comparable apps charge in over 150 countries, so a candidate price point starts from observed market behaviour rather than a guess. Once you have decided on a price, Mirava applies it across App Store, Google Play, and Stripe, either on your approval or within rules-based caps you set.
Test one variable at a time, and set your target before you start. That discipline is what makes the result readable, whichever tool runs the split.
Ending
To make sure your app pricing works best, begin by setting simple, clear goals - like adding 10% more to monthly earnings or getting more users to buy after a trial. These goals help keep your tests on pricing tight and useful.
Good pricing tests need well-set experiments. By changing just one thing at a time, you can truly see what changes how users act. Make sure users are picked at random for test groups and that you use enough of them to show true patterns, not just chance.
After you get your test data, take time to clean and ready the data. Look for gaps, fix odd data points, and make formats the same across areas to make sure your findings are solid. Use stats tests to tell real changes from chance.
Looking closely at details often gives the best insights. See how price changes hit different types of customers, places, or ways of getting users. This can show chances you may have missed.
Pricing by region adds more layers of both complexity and chance. What works in one place - like the U.S. - might not work in others, like Brazil or Switzerland. Tools like Mirava help by setting prices for over 175 countries. They manage money changes, track money in real-time, and keep things legal, saving developers time and helping keep prices good in many places.
Each part of your pricing test, from goals to handling area changes, helps in making a growing, changing plan. The key to lasting success is seeing pricing as an ongoing thing, not just a one-time act. Writing down each test - your ideas, setup, numbers, and outcomes - builds a base of knowledge that gets more useful as markets and user acts change.
FAQs
How can I know if my app price test is right and not messed up by outside things?
To get good results from your app price test, it's key to run it for a while. This helps deal with times like weekends, holidays, or changes in the season, which might mess up your results.
It's also key to split your users right. When you match groups that act and spend alike, you make sure your results aren't thrown off by mixing very different kinds of users. Also, watch for things like changes in money value, what your rivals charge, or big money events. These things can change your results, so you need to think about them when you look at your data.
How can you set prices for your app that get more money from users?
To get more cash from your app, set prices to match what people in each area can pay or are used to. Look at local money power, changes in money value, and what others charge. When you change your prices right, your app will draw more users and still make profit.
Mirava has tools that help you fix your charges for each place, whether people use iOS, Android, or the Web. These tools cut work time and stop price mistakes - like asking too much or too little - which helps you earn more.
How can I use the prices we try out to make a long-term plan for what my app should cost?
To make a good long-term plan on what to charge for your app, start by looking at the results from your price tests. Dig into the data to see how users act and if money flow changes. Watch closely for trends that show how users deal with different prices and how these changes affect how much money your app makes.
Use what you learn to adjust your app's prices for different places. Think about how much money people have there and what the market is like to get the price just right - keeping your app well-placed in competition and making more money too. Tools like Mirava can help with this, letting you set prices for each region well and fast.