Regional pricing helps app developers adjust costs based on local markets, improving accessibility and boosting revenue. A single global price often alienates users in lower-income regions or undervalues your product in wealthier areas. By tailoring prices to economic conditions, purchasing power, and user behavior, you can increase conversions and retain more customers.
Here’s how to do it:
- Understand local market conditions: Use metrics like Purchasing Power Parity (PPP) and GDP per capita to set fair prices.
- Research competitors: Analyze how others price in your target regions to find gaps or opportunities.
- Gauge user purchasing power: Study user data to identify price sensitivity and test different pricing strategies.
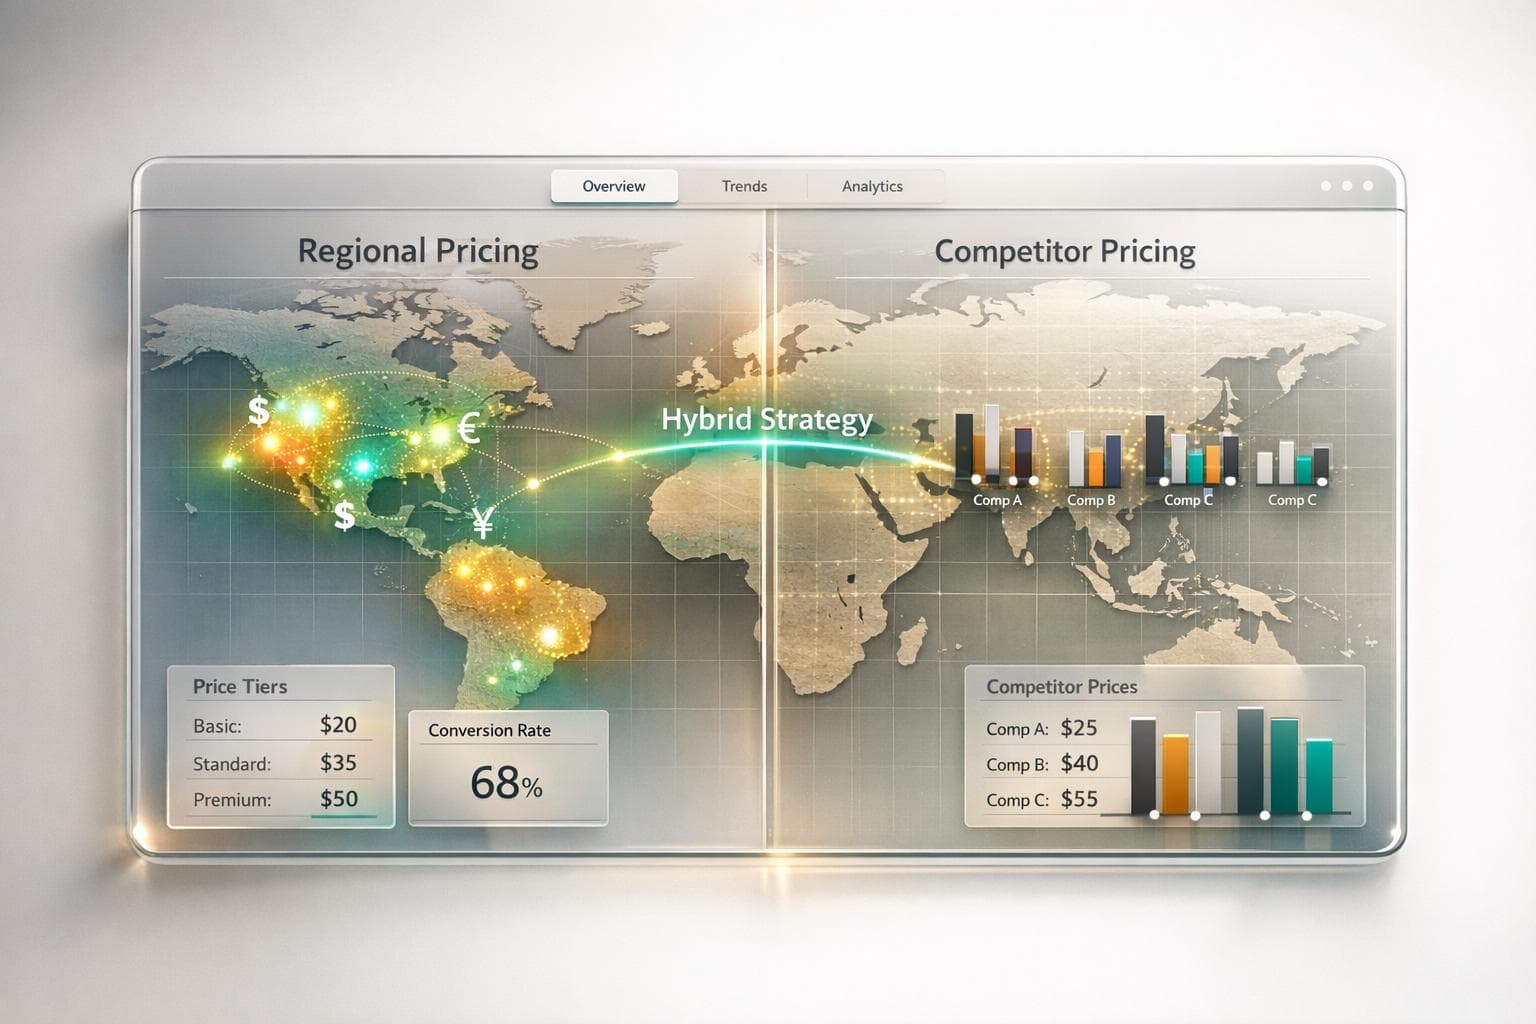
- Leverage automated tools: Platforms like Mirava simplify managing regional prices across iOS, Android, and Stripe.
- Monitor and adjust: Track key metrics like revenue, conversion rates, and churn to refine your strategy.
Localized pricing has proven results - companies have seen revenue increases of over 50% and doubled conversions in key markets by implementing these steps. By automating and continuously refining your approach, you can maximize global revenue while keeping pricing fair and competitive.
Step 1: Check Local Market Conditions
Understanding local market conditions is crucial for setting competitive prices. Without this knowledge, it’s impossible to determine what users can afford or how your market stacks up against others. This involves diving into economic data, analyzing user behavior, and keeping an eye on market trends that could influence your pricing. By doing this groundwork, you’ll be better prepared to adjust prices regionally and effectively.
Economic Indicators to Consider
Key metrics like Purchasing Power Parity (PPP), Foreign Exchange (FX) rates, and GDP per capita are essential for shaping your pricing strategy. PPP helps you gauge how affordable your pricing is across different regions. For example, a $9.99 subscription might cost someone in San Francisco an hour of work, but in other markets, it could represent several hours of income. In fact, willingness to pay may be 20–50% lower in some areas [4]. GDP per capita offers a snapshot of local income levels and spending habits, helping you group markets with similar price sensitivities.
While currency fluctuations also play a role, it’s better to base your pricing on PPP. A smart strategy combines PPP for setting fair baseline prices with FX rates to ensure pricing tiers remain aligned with current market realities.
Leveraging User Data and Sales Trends
Your existing user data can be a goldmine for refining regional pricing. By studying purchase history, conversion rates, and user feedback, you can uncover local demand patterns and gauge price sensitivity [2]. For example, if a region shows high engagement but low conversions, pricing could be the issue. Additionally, analyzing sales data can reveal which subscription models work best in specific markets - some regions might favor discounted annual plans, while others lean toward flexible monthly options.
User reviews often provide direct clues. Comments like "too expensive" or "great value" can give you a quick read on how your pricing resonates locally. Many teams know their pricing in emerging markets isn't right but lack the time or understanding to fix it - yet rolling out country-specific pricing can reduce churn quickly once it better reflects local affordability.
After analyzing user data, it’s important to keep monitoring trends to ensure your pricing remains competitive.
Stay Ahead of Market Changes
Building on economic and user insights, your pricing strategy should evolve alongside market dynamics. Regularly track competitor pricing, seasonal trends, and local events to stay relevant [4]. For instance, knowing your competitors’ pricing can help you identify whether adjustments or highlighting unique app features are necessary. Seasonal events like local festivals, holiday shopping periods, or back-to-school sales can also have a significant impact on purchasing behavior. Timing promotions around major events like Black Friday in the US or Singles’ Day in China can boost sales in those regions.
Cultural preferences play a big role too. While discounts and limited-time offers might be effective in some areas, other markets may prioritize premium features or long-term plans. Continuously reviewing market trends and user data ensures your pricing stays aligned with both local realities and your revenue goals.
Step 2: Research Competitor Pricing in Target Regions
After evaluating local market conditions, the next move is to dive into competitor pricing. Understanding how your competitors price their apps in various regions can uncover opportunities to fine-tune your own pricing strategy. A one-size-fits-all global price often overlooks potential revenue gains in specific markets. By studying competitor pricing, you can identify gaps and hit those "sweet spots" where tailored pricing can boost your market share.
How to Track Competitor Prices
Tracking competitor prices requires a methodical approach. Start by identifying your direct and indirect competitors. Direct competitors offer similar features to the same audience, while indirect competitors solve the same problem but in different ways.
You can gather this data through a mix of manual research and automated tools. For manual research, use VPNs or regional accounts to check local pricing on platforms like the App Store and Google Play. Note competitor prices, any special offers, and seasonal adjustments. Regularly monitoring prices - ideally monthly - helps you stay ahead of changes.
This strategy has proven effective for many companies. For example, case studies from SuperScale and Spotify show that revising pricing based on competitor research and local market conditions can lead to revenue increases of up to 50% in certain regions [3][2].
Build a Price Comparison Table
Turning raw pricing data into actionable insights is easier with a price comparison table. Include details like competitor name, app or product, region, local price, USD equivalent, pricing tier, and any special offers.
| Region | Competitor 1 Price | Competitor 2 Price | Your App Price | Opportunity |
|---|---|---|---|---|
| United States | $4.99 | $5.49 | $4.99 | Matches lowest price |
| Germany | €4.49 | €4.99 | €4.29 | Slightly undercuts market |
| India | ₹299 ($3.59) | ₹349 ($4.19) | ₹249 ($2.99) | Most affordable option |
For instance, one productivity app discovered that competitors in India heavily discounted their prices to account for lower purchasing power, while prices in the U.S. stayed higher. By adjusting their pricing in India, they were able to capture a larger share of the market.
When creating your table, also consider how competitors handle currency fluctuations and local taxes. Some companies absorb these costs, while others pass them on to customers. Understanding these strategies can help you position your pricing more effectively.
Know Platform Pricing Rules
Once you've mapped out competitor practices, ensure your strategy aligns with platform pricing rules. Adhering to these rules is essential. Both the Apple App Store and Google Play have specific guidelines for setting and adjusting prices across regions. For example, the App Store uses predefined price tiers that convert automatically to local currencies, while Google Play allows more flexibility with custom local pricing.
Many teams avoid touching pricing because it feels like too much work. With the right tooling, you can test new strategies without wrestling with spreadsheets or App Store rules - which removes a major barrier to growth.
Additionally, platform rules often require notifying subscribers of pricing changes within a specific timeframe. Legal considerations, such as VAT in Europe or GST in India, also need to be factored into your plan [4]. Staying compliant not only builds trust with your users but also ensures your pricing strategy is both competitive and sustainable.
Step 3: Check User Purchasing Power and Price Sensitivity
Knowing what your users can afford and how they respond to different price points is key to boosting revenue across various regions. While competitor research gives you a sense of the market, understanding purchasing power and price sensitivity helps you pinpoint the sweet spot where affordability meets profitability. This step ensures you don’t fall into the trap of simply converting prices between currencies without accounting for local economic conditions. It builds on earlier steps by layering in insights about what users in different regions can realistically pay.
Measure Local Purchasing Power
To gauge affordability, start with Purchasing Power Parity (PPP) indices. These indices compare the cost of living and income levels across countries, offering a baseline for setting prices. Supplement this data with metrics like GDP per capita and average household income to get a clearer picture of what your target audience can afford.
For instance, a $4.99 monthly subscription might be a negligible 0.1% of the average monthly income in the U.S., but in countries with lower purchasing power, it could take up 2-3% of someone’s income. That’s why straightforward currency conversion often misses the mark in capturing market potential.
A great example of this approach comes from a 2023 pricing experiment by SuperScale and Nimblebit. They adjusted in-app purchase prices by cutting them by 50% in Tier 3 countries (regions with lower purchasing power) and increasing them by 20% in Australia, a Tier 1 country. The results were impressive: a 22% increase in Google Play revenue and over 50% growth in iOS revenue. Even more striking, conversion rates jumped from 0.79% to 1.37% [2].
A well-executed PPP pricing strategy can be a meaningful lever for subscription plans, helping align prices with what users in each market can realistically afford.
Today, advanced pricing tools combine PPP data with foreign exchange rates to determine the ideal price for each region. This ensures pricing stays fair and accessible while maximizing revenue potential across diverse markets.
Identify Users Sensitive to Price Changes
Not all users respond to price changes the same way, so identifying those most sensitive to pricing is essential. Start by analyzing purchase histories to spot patterns. Users who only buy during discounts or promotions are typically more price-sensitive. Similarly, demographic factors like region, age, and device type can reveal how different groups react to pricing.
Other clues come from transaction data and surveys. For example, users who abandon their carts at checkout, downgrade subscriptions, or wait for sales are likely price-sensitive. Analytics tools can track these behaviors and help you fine-tune your pricing approach.
Geographic segmentation often highlights clear trends. Users in emerging markets are usually more price-conscious, while those in developed regions may prioritize features and convenience over cost. Even the type of device users own can be a clue - those with older or budget devices often have different spending habits than users with premium devices.
Test Pricing Ideas with A/B Testing
A/B testing takes the guesswork out of pricing decisions. Instead of relying on assumptions, this method lets you test different price points and discover what works best. The key is to adjust one variable at a time - whether it’s price, subscription length, or promotional offers - while keeping everything else constant.
Start small by testing on limited user segments to minimize risk. Experiment with different price points and track metrics like conversion rates, revenue per user, customer lifetime value, and churn rates. These insights will help you understand how pricing changes impact your bottom line.
To ensure reliable results, your tests need enough data and time to capture user behavior patterns. A two-week testing period is often sufficient, but subscription-based apps may require longer to measure retention rates accurately.
The process works best when done iteratively. Begin with broader price ranges to identify general sensitivity, then refine your tests to zero in on the most effective price points. Modern pricing platforms make this easier by automating test setups, ensuring compliance with app store rules, and providing real-time analytics. This removes much of the complexity that previously made pricing experiments daunting for developers.
Once your tests validate the best pricing strategies, you’ll be ready to move on to implementing automated tools for continuous pricing adjustments.
sbb-itb-43fe43a
Step 4: Use Automated Pricing Tools
Once you've experimented with price points and analyzed user behavior, it's time to take things to the next level with automated pricing tools. As your app expands, managing pricing manually across various regions and platforms can quickly turn into a logistical headache. Automated tools simplify this process, saving you time and reducing the risk of costly mistakes. They also ensure your pricing stays competitive and aligns with local regulations.
Why Automate Your Pricing?
The biggest perk of automation? Time savings. What used to take hours - or even days - can now be done in minutes.
Automation also reduces human errors that could otherwise hurt your bottom line. Mistakes like incorrect currency conversions, misapplied tax rates, or forgetting platform-specific pricing rules can lead to compliance issues or lost revenue. Automated systems apply updates consistently and ensure you meet app store policies and local legal requirements, helping you avoid penalties [4].
Another key benefit is protection against grey market abuse. Automation helps block users who exploit price differences between regions by using VPNs to buy from cheaper markets [3].
And let's not forget the financial upside. Automated regional pricing can lead to noticeable improvements in conversion rates and overall revenue across different markets [2].
Mirava: A Game-Changer for Regional Pricing
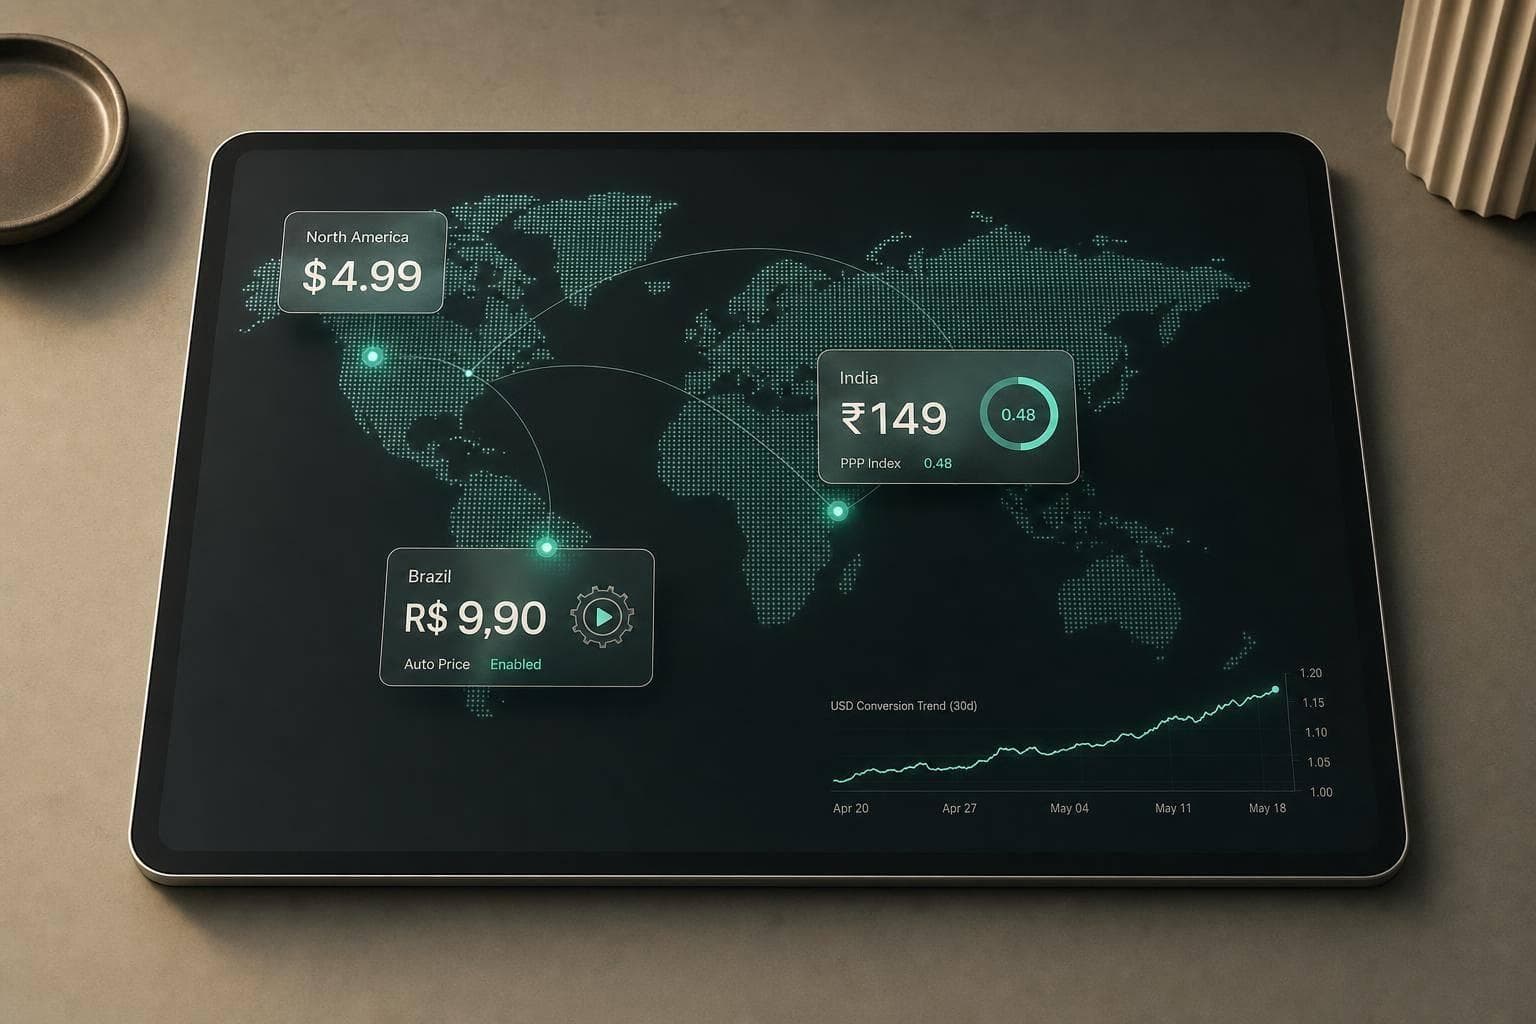
Tools like Mirava bring these automation benefits to life. Mirava consolidates pricing management for iOS, Android, and Stripe into one user-friendly dashboard, supporting pricing in over 170 countries. This eliminates the hassle of switching between multiple platforms and ensures your pricing remains consistent everywhere your app is available.
One standout feature is batch price updates. Instead of updating prices region by region, you can roll out changes across all platforms and countries in just a few clicks. This is especially handy when you need to respond quickly to currency fluctuations or competitor moves.
Mirava also uses PPP-based pricing adjustments to calculate optimal prices for each region. By combining purchasing power parity data with foreign exchange rates, the platform ensures your pricing is both fair and strategically aligned to maximize revenue in diverse markets.
The revenue impact preview takes the guesswork out of pricing decisions. You can model different strategies and see their potential financial impact before making changes live. This feature allows you to experiment confidently, knowing you have a clear picture of the possible outcomes.
For those looking to test new pricing strategies, we publish a guide to running and measuring pricing experiments. Mirava itself does not run the split. What it does is give you the candidate price worth testing, and apply it across the stores once you approve it, or within rules-based caps you set.
Collaboration Made Easy
Pricing decisions often involve input from multiple team members - product managers, finance teams, and more. Mirava's team collaboration features make this process smoother and more efficient.
The drafts system lets team members prepare pricing updates without immediately applying them. This is especially useful for larger organizations where changes need to go through a review process. Teams can collaborate on strategies, make adjustments, and align on decisions before pushing updates live.
For added oversight, Mirava includes approval workflows. These ensure that pricing changes are reviewed and signed off by the appropriate stakeholders. Notifications and audit trails keep everything transparent and organized, preventing unauthorized changes and streamlining the approval process.
These collaboration tools are particularly valuable when managing pricing across multiple apps or regions. With a centralized dashboard, everyone has access to the same data and can track the progress of pricing initiatives in real time. This level of teamwork makes it easier to respond to market changes quickly, setting the stage for continuous pricing adjustments in the next phase.
Step 5: Track Results and Adjust Pricing
Once you've implemented automated pricing, the work doesn't stop there. It's crucial to monitor how your pricing strategy performs and make adjustments based on the data you gather. Markets are constantly shifting - consumer behavior evolves, competitors tweak their strategies, and economic conditions fluctuate. Your pricing needs to keep pace with these changes.
Track Key Performance Metrics
To stay ahead, focus on the metrics that matter most. Revenue per region is a good starting point, as it shows how your pricing performs across different markets. But don't stop at revenue - dig deeper to uncover what’s driving those numbers.
Conversion rates are another valuable metric. They tell you how many users are actually making purchases at your current price points. For instance, when SuperScale worked with Nimblebit in 2023 to test regional pricing in games like Pocket Planes and Pocket Trains, they saw conversion rates jump from 0.79% to 1.37% after adjusting prices - reducing in-app purchase prices by 50% in Tier 3 countries and increasing them by 20% in Australia [2].
Metrics like average revenue per user (ARPU) and customer lifetime value (CLTV) can help you assess the long-term effects of your pricing decisions. While lowering prices might boost conversions, it could backfire if ARPU drops significantly without improving customer retention.
Don’t forget to monitor churn rates by region. Teams that introduce region-specific pricing often see churn drop once prices better match local affordability. This metric can reveal whether your pricing feels reasonable to users in different areas.
Here’s an example of key metrics broken down by region:
| Region | Sales Volume | Purchases | Conversion Rate | Local Price | USD Value | Churn Rate |
|---|---|---|---|---|---|---|
| North America | 10,000 | 500 | 5.0% | $25.00 | $25.00 | 2.5% |
| Germany | 5,000 | 200 | 4.0% | €22.00 | $23.76 | 3.0% |
| Brazil | 7,500 | 150 | 2.0% | R$99.00 | $19.80 | 4.5% |
| India | 6,000 | 120 | 2.0% | ₹1,200 | $14.40 | 5.0% |
Also, keep an eye on customer support tickets. Complaints about high prices in certain regions or confusion over price differences between countries might signal the need for a pricing review.
These metrics are the foundation for continuous testing and fine-tuning.
Keep Testing and Improving
Use the data you gather to guide A/B testing. Markets can shift quickly, and so can the willingness to pay. In some regions, consumers may value your product 20–50% less than in the U.S. or Western Europe [4]. These differences aren’t static - they evolve as economies grow and purchasing power changes.
The results from SuperScale’s regional pricing strategy highlight the importance of testing and adapting. Their adjustments led to a 22% increase in Google Play revenue and over a 50% boost in iOS revenue [2]. In the case of Pocket Trains, revenue in affected countries more than doubled [2]. These gains weren’t accidental - they came from ongoing testing and refinement.
Many developers shy away from A/B testing because it can seem overwhelming. Teams often avoid adjusting pricing due to the perceived complexity, but with the right tooling you can test new strategies without worrying about spreadsheets or App Store rules - removing a major barrier to growth.
To make the most of A/B testing, focus on one variable at a time and ensure your results are statistically significant. This approach helps you pinpoint exactly what’s driving changes in user behavior.
Review and Update Pricing Plans
Make it a habit to review your pricing strategy every quarter. This isn’t just about staying competitive - it’s about ensuring your approach aligns with the current market landscape.
Currency fluctuations can have a big impact. A price that seemed fair six months ago might now feel too high - or suspiciously low - because of exchange rate changes. Keep an eye on economic indicators like inflation, unemployment, and GDP growth in your key markets to guide your decisions.
Also, stay updated on platform-specific changes. App stores like Google Play and the App Store frequently update their pricing policies, commission structures, and available price tiers. They may also expand to new regions, all of which can influence your pricing strategy. Regularly revisiting these factors ensures your pricing stays optimized for both your audience and the platforms you use.
Conclusion: Increase Revenue with Better Pricing
Regional pricing can completely change how your app performs globally. The five steps outlined here offer a straightforward way to tap into local pricing opportunities in various markets.
The results speak for themselves. For instance, conversion rates increased from 0.79% to 1.37%, and in some regions, revenue more than doubled [2]. These numbers highlight the impact of moving away from a one-size-fits-all pricing strategy, which often fails in 80% of markets.
It all comes down to executing systematically. Start by diving into the specifics of your local markets - understand purchasing power, price sensitivity, and what your competitors are doing. Use automation to simplify the process of implementing and managing your pricing strategy across regions. Then, track your results and fine-tune your approach based on actual performance data.
Tools like Mirava make this process much easier by integrating iOS, Android, and Stripe pricing into one dashboard. Forget wrestling with spreadsheets or manually updating prices for over 170 countries. With Mirava, you can apply data-driven Purchasing Power Parity (PPP) strategies and update prices across platforms in minutes. Apps that move from a single global price to localized, data-driven pricing often see meaningful revenue gains, reinforcing the value of the five-step approach.
What once seemed like an overwhelming task - regional pricing - has become manageable. Success lies in tailoring your pricing to fit local conditions. By following these steps and using tools designed to simplify the process, you can turn regional pricing into a powerful revenue driver. Isn’t it time to take the plunge?
FAQs
How can app developers use Purchasing Power Parity (PPP) to set the right prices for different regions?
App developers can use Purchasing Power Parity (PPP) to create pricing strategies that align with the economic realities of different regions. By factoring in local purchasing power and currency values, PPP helps determine what users in various countries can reasonably pay.
To make the most of PPP, collect data on local purchasing power, currency exchange rates, and regional market trends. This approach ensures your app's pricing feels fair to users while also driving revenue growth. By tailoring prices to match affordability and market conditions, you can strike the right balance - avoiding both overpricing and undervaluing your product in international markets.
How can automated tools like Mirava simplify regional pricing strategies?
Automated tools such as Mirava simplify the challenge of managing regional pricing by helping you set competitive prices across different countries and platforms. These tools factor in variables like currency fluctuations, local purchasing power, and market trends, ensuring your app is priced appropriately for each region.
By automating these processes, you not only save valuable time but also open the door to increasing global revenue. In fact, aligning prices with local purchasing power can meaningfully improve conversion rates. Plus, having everything centralized in one platform reduces the hassle, giving you more bandwidth to focus on growing your app’s reach and success.
How can researching competitor pricing reveal regional market opportunities?
Understanding how competitors price their apps in different regions can reveal gaps and opportunities in the market. For instance, it might show areas where competitors are pricing too low or too high, giving you a chance to refine your pricing strategy to gain an edge.
By factoring in elements like local purchasing power, currency changes, and market demand, you can spot new revenue opportunities and set prices that strike a balance between competitiveness and appeal. This approach helps keep your app attractive and profitable across various regions.