Seasonal pricing can make or break your app's revenue. Without proper testing, price changes during holidays or high-traffic periods can lead to unexpected drops in subscribers or missed opportunities for growth. A/B testing helps you avoid guesswork by comparing pricing strategies in real-time, isolating their true impact.
Key takeaways:
- Seasonal events like Black Friday or New Year can boost app sales by over 50%, but poorly timed price hikes risk losing users.
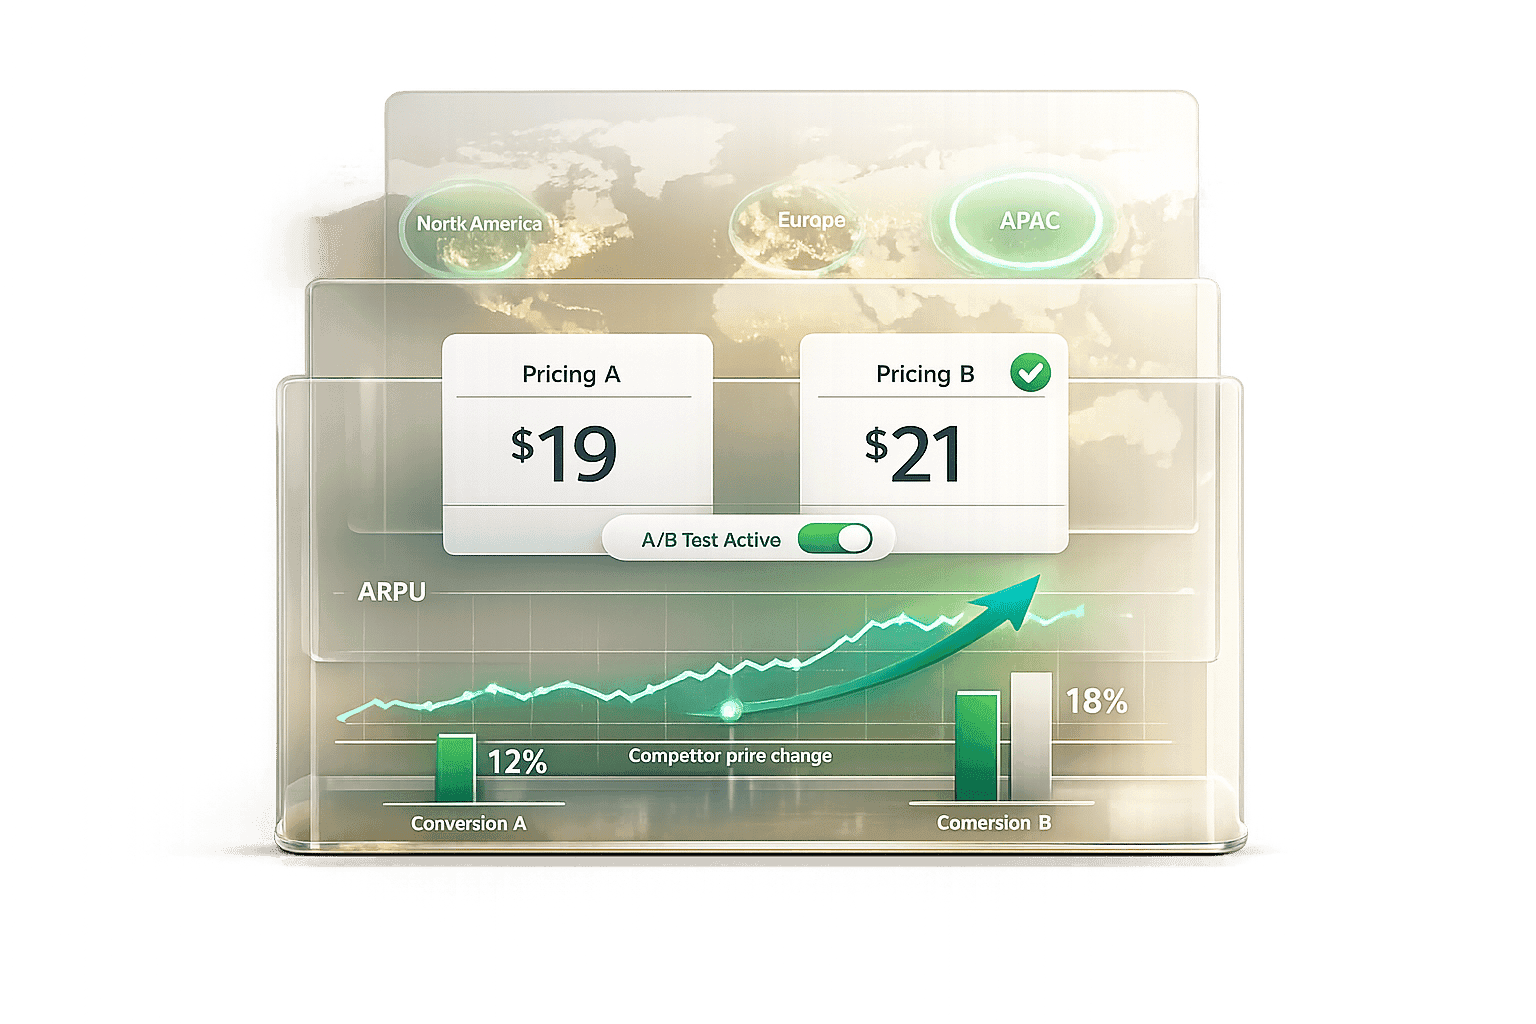
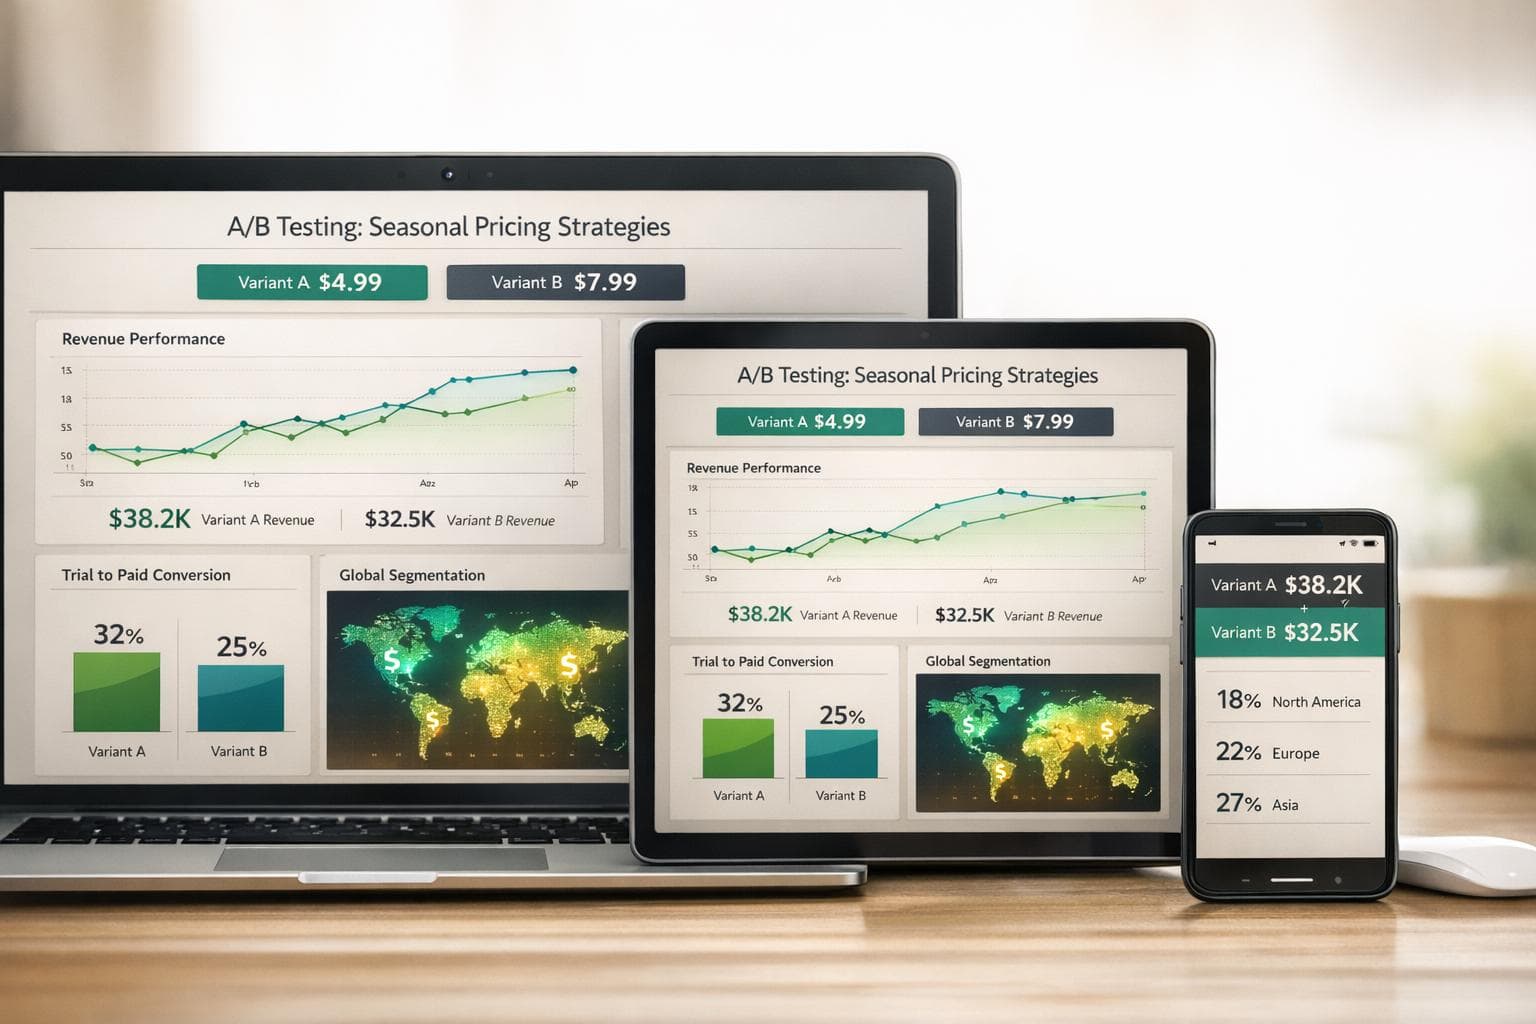
- A/B tests compare original prices with seasonal adjustments, revealing what works best.
- Focus on metrics like Lifetime Value (LTV), churn rates, and trial-to-paid conversions to gauge success.
- Tools like Google Play Console and App Store Connect simplify creating pricing variants.
- Regional pricing and user segmentation are essential to account for differences in purchasing power.
Pro tip: Plan pricing experiments 2–3 months in advance, test with at least 1,000 users per variant, and aim for a 95% confidence level to ensure reliable results.
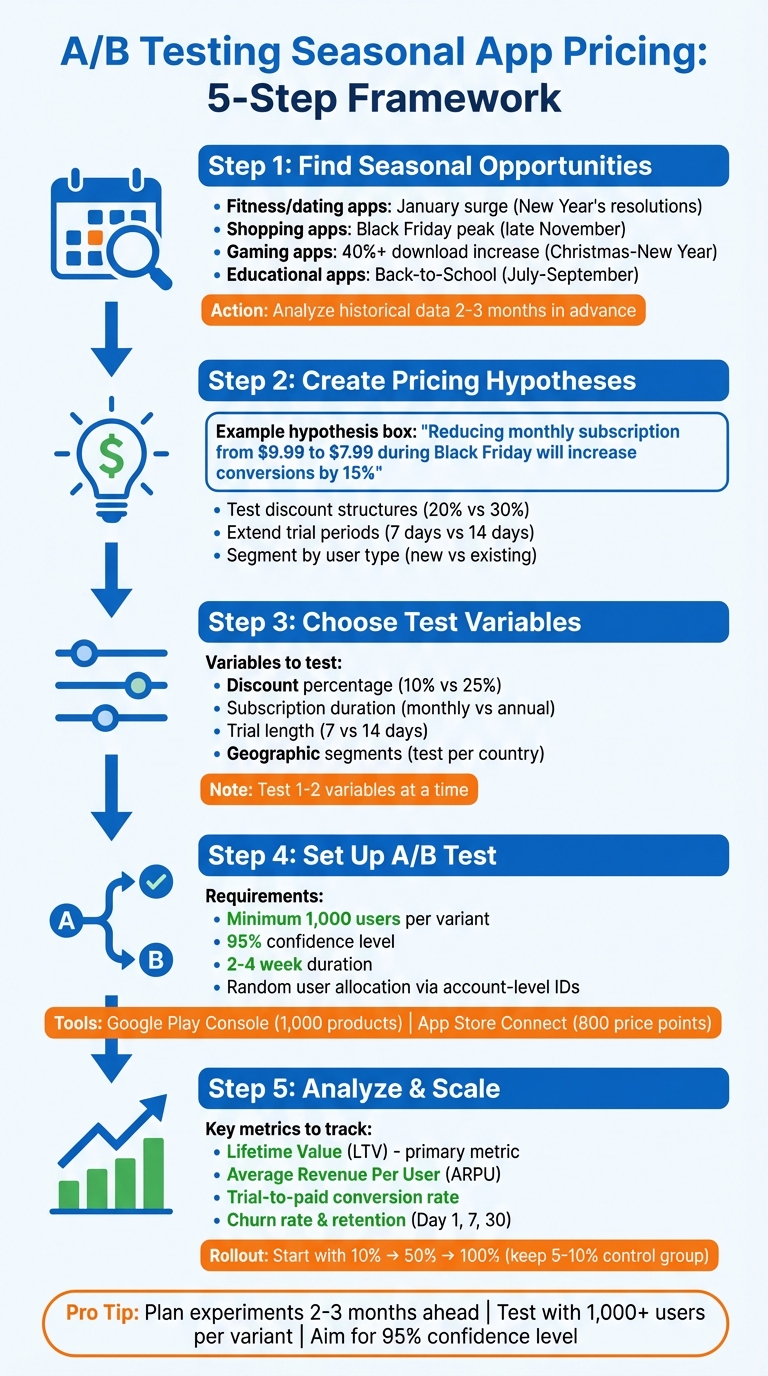
A/B Testing Seasonal App Pricing: 5-Step Framework
A/B Price Testing for Mobile Apps
sbb-itb-43fe43a
Finding Seasonal Pricing Opportunities
Seasonal events can have a big impact on app performance, and different categories thrive at different times of the year. For example, fitness and dating apps often see a surge in January as people commit to New Year’s resolutions, while shopping apps hit their peak around Black Friday in late November [8][2].
Educational and productivity apps also experience seasonal spikes, especially during "Back-to-School" periods. In the U.S., this usually happens between July and September [2][9]. Meanwhile, in Japan, consumer spending often rises in late March, coinciding with the fiscal year-end when bonuses are distributed, and companies finalize their accounts [10].
To uncover these opportunities, start by digging into your app's historical data. Look for recurring patterns in revenue, downloads, and churn [8][3]. Tools like AppTweak can help by showing historical keyword trends - for instance, searches for "tax preparation" often climb in spring, while "summer workouts" trend in June [8][9].
Don’t forget to factor in regional holidays and festivals. While Christmas drives massive sales in the U.S. and parts of Europe, it may not have the same impact in areas with different cultural calendars. Events like Lunar New Year in East Asia, Diwali in India, or Carnival in Brazil open unique windows for promotions that require tailored strategies [2][9].
Keeping an eye on competitors can also provide valuable insights. Use app store optimization (ASO) tools to track when they update icons, tweak keywords, or roll out promotional campaigns [7][2]. These updates often signal their plans for seasonal events, which can help you time your own efforts.
Planning ahead is crucial. For example, during the U.S. Christmas-to-New Year period, gaming app downloads can jump by over 40%, with significant returns on ad spend [10]. Start preparing campaigns 2–3 months in advance to make the most of these opportunities.
Once you’ve identified key seasonal events, it’s time to develop and test specific pricing strategies.
Creating Pricing Hypotheses
After spotting a seasonal opportunity, the next step is to craft clear, testable pricing hypotheses. Instead of making vague assumptions like “lower prices will boost sales,” aim for something measurable, such as:
"Reducing our monthly subscription from $9.99 to $7.99 during Black Friday will increase conversions by 15% without significantly affecting long-term retention."
Experiment with different discount structures rather than applying a blanket price cut. For instance, compare a 20% discount to a 30% discount [4]. Some apps also find success by extending trial periods - offering 14 days instead of 7 during seasonal events can lead to higher conversion rates.
Tailor your hypotheses to different user segments. New users and existing users often behave differently during seasonal promotions. For example, a strategy for new users might focus on converting first-time purchases, while for existing users, you could test upgrades or renewals. Keep in mind that seasonal shoppers tend to act more impulsively but may also churn faster once prices return to normal [6].
Short-term offers can be effective, but they should be compared to permanent price changes. A countdown timer, such as "48 hours left", can create urgency, but it’s worth analyzing whether this approach generates more revenue than a longer sale. As Anastasiia Kopetska, Junior Graphic Designer at SplitMetrics, points out:
"Black Friday and Cyber Monday are two examples where proper copy is essential. Use bold fonts and vibrant colors to make call-to-action messages like 'Shop Now,' 'Save,' or 'Claim the Deal' create a sense of urgency" [7].
Choosing Variables to Test
Once your hypotheses are set, focus on one or two pricing variables at a time to keep your tests manageable and results clear. Common variables include:
- Discount percentage (e.g., 10% off vs. 25% off)
- Subscription duration (monthly vs. annual)
- Trial length (7 days vs. 14 days)
- Introducing a mid-tier pricing option
Geographic segmentation is another critical factor. Test pricing strategies separately for each country instead of grouping regions together [4]. Purchasing power varies widely - a $4.99 price might be too high for users in India but too low in Switzerland. Similarly, regional holidays like Singles' Day in China (November 11) often require different pricing approaches compared to Thanksgiving in the U.S. [4][8].
Visual elements can also play a role in pricing experiments. For example, in October 2023, game developer MyTona tested a Halloween-themed app icon featuring a "pumpkin head" against their standard icon using the SplitMetrics Optimize platform. The seasonal icon boosted conversion rates by 9.3%, and similar updates have been shown to increase installs by up to 40% [7].
Finally, align your tests with your long-term goals. If you're focused on lifetime value (LTV) rather than immediate sales, prioritize strategies that may reduce short-term gains but improve retention over time [6]. By carefully selecting variables and testing them methodically, you can develop pricing strategies that resonate with your audience and maximize your app’s performance.
Setting Up A/B Tests for Seasonal Pricing
Once you’ve nailed down your hypotheses and variables, it’s time to set up your test to focus solely on the impact of seasonal pricing. The key steps? Create clear pricing variants, distribute users randomly, and track the right metrics. These basics ensure you get accurate results, helping you fine-tune your pricing strategy for seasonal success.
Creating Pricing Variants
To test different pricing options, you can use tools like Google Play Console and App Store Connect to adjust in-app product prices. Google Play Console allows you to experiment with up to 1,000 in-app products at once. You can apply price changes ranging from a 1% to 99% decrease or a 1% to 999% increase [5]. For example, if your monthly subscription is typically $9.99, you might try a 20% discount for a Black Friday promotion, bringing the price down to about $7.99.
For iOS apps, App Store Connect provides access to 800 price points across 43 currencies [11]. Apple simplifies pricing adjustments by letting you set a base country price, which automatically generates equivalent prices for 174 storefronts using current exchange rates. You can also schedule seasonal pricing tiers by setting "Start Date" and "End Date" properties [12].
To avoid skewing your results, include all relevant in-app products in your experiment. This ensures users don’t switch to untested products, which could mess with your data [5].
Randomizing and Segmenting Users
Once you’ve defined your pricing variants, it’s crucial to allocate them fairly among users. Use account-level unique IDs instead of device-level IDs to assign users to groups. This avoids counting the same user multiple times if they’re using more than one device [4]. As Jakub Chour, Head of Growth at HER, points out:
"Just making a change to pricing across all of your customers and then monitoring the results that follow won't allow you to reliably infer the impacts of that change because your test results might be skewed by multiple external factors, like seasonality" [4].
Geographic segmentation also plays a significant role. Testing within individual countries helps account for differences in purchasing power and exchange rates. For example, a $4.99 price might work in the U.S. but could be too high for other regions. You can follow a guide on how to set up purchasing power parity pricing to ensure your app remains affordable globally. To ensure everything is set up correctly, validate your test using installation auth tokens [13].
Using Mirava for Pricing Automation
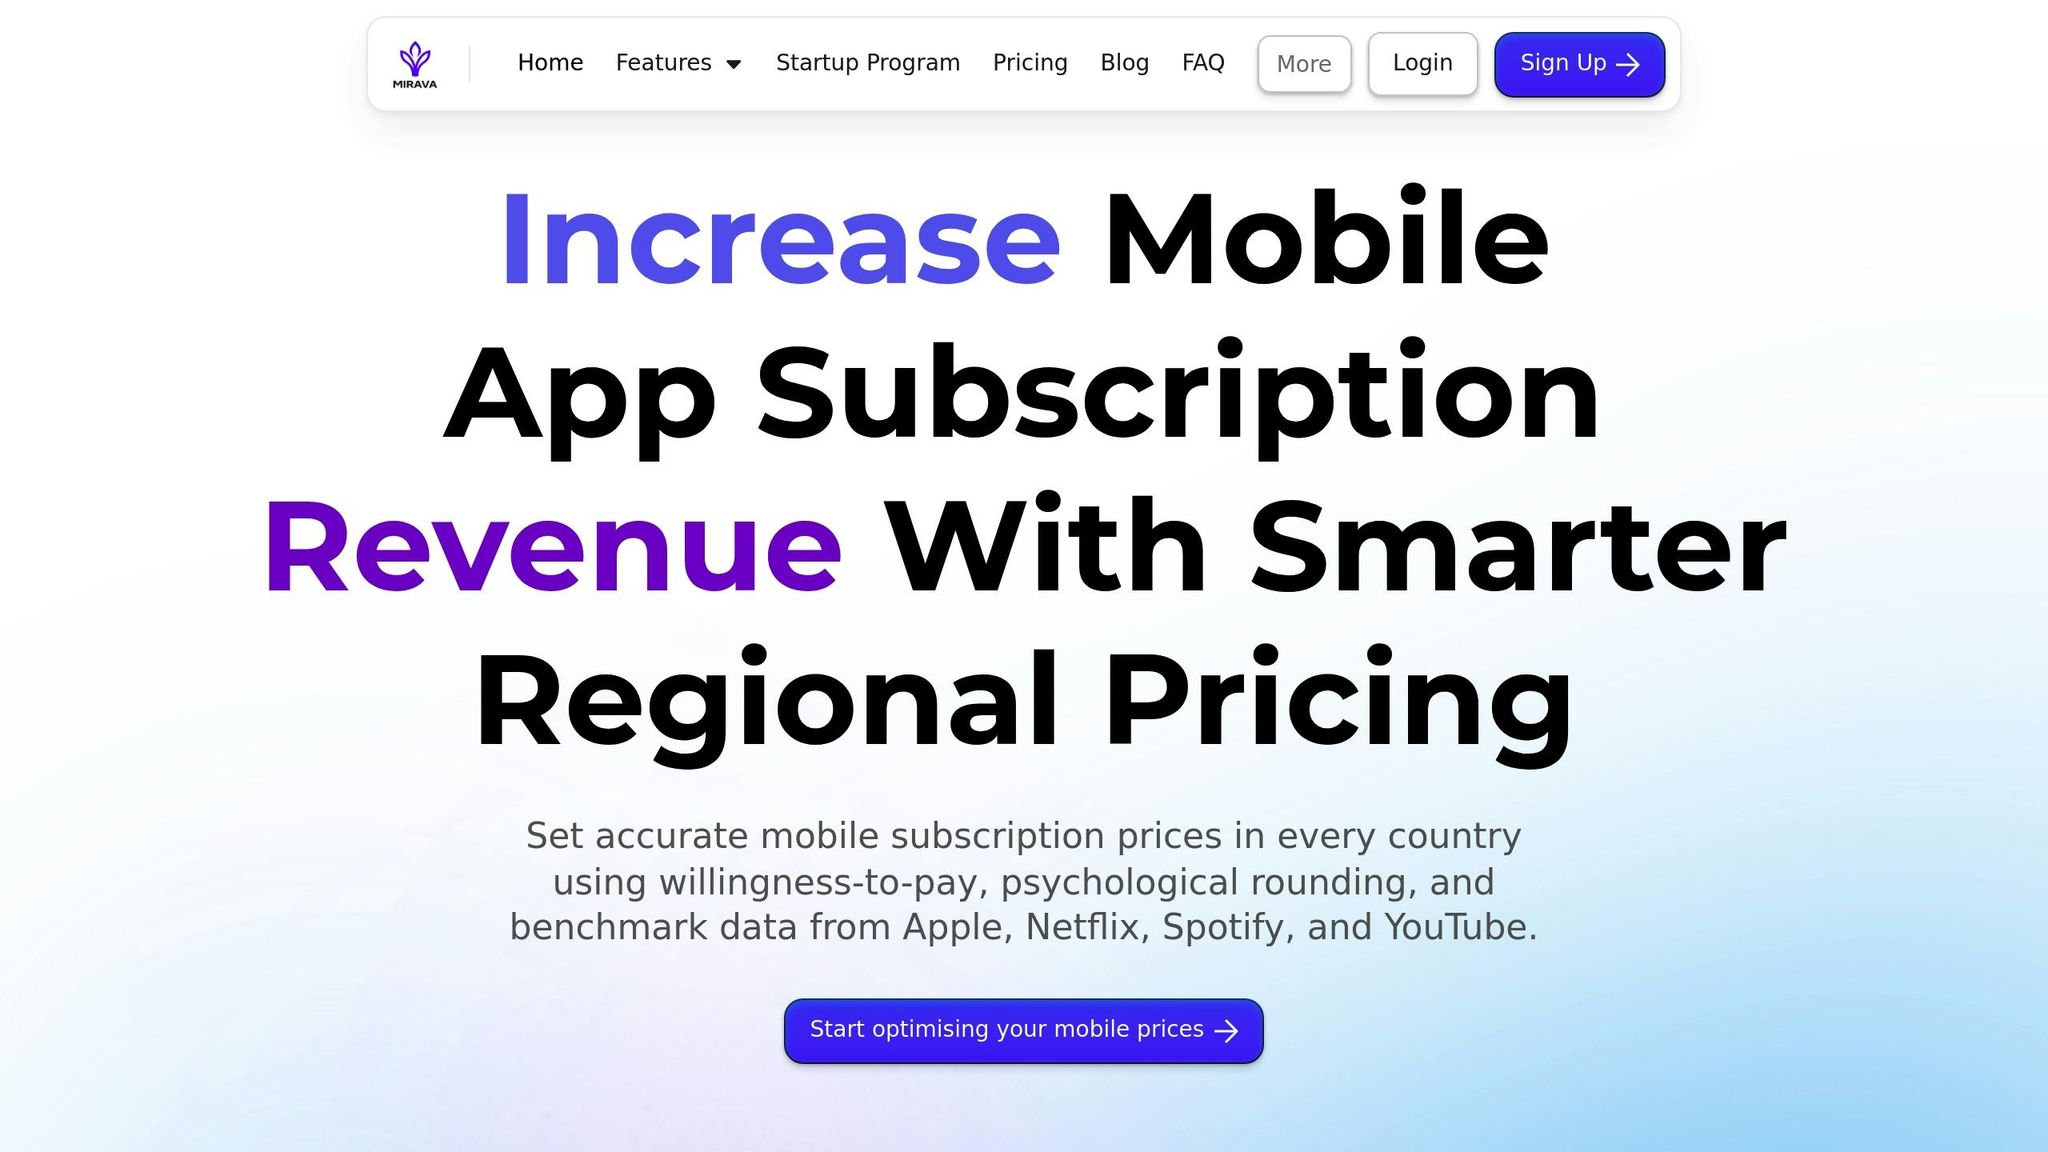
Managing seasonal pricing across multiple countries can get complicated, but Mirava makes it easier. Instead of manually updating prices for over 175 storefronts, Mirava’s batch update feature lets you sync pricing changes across iOS, Android, and Web platforms with just one click. It handles localized pricing, tier mapping, and price syncing across Apple, Google Play, and Stripe, saving you time and reducing errors. Mirava also provides revenue and conversion previews, supports team collaboration, and includes approval workflows to keep everything running smoothly [1].
Analyzing Seasonal A/B Test Results
Once your tests are live, the next crucial step is to dive into the data. The goal? To figure out if your pricing changes are boosting revenue and to ensure the results are solid enough to guide your next moves.
Key Metrics to Track
It's tempting to zero in on conversion rates, but don't stop there. A lower seasonal price might bring in more buyers initially, but if those customers churn quickly or spend less over time, your overall revenue could take a hit. Jakub Chour, Head of Growth at HER, highlights this perfectly:
"Lifetime value (LTV) is the key metric you're looking to grow through your price experiments" [4].
To truly assess your pricing strategy, focus on Average Revenue Per User (ARPU) and Lifetime Value (LTV). For instance, if your seasonal discount attracts "bargain hunters" who cancel after a month, your LTV will decline - even if your conversions look good at first. Keep an eye on churn rates and retention metrics (Day 1, 7, and 30) to identify any red flags early on [1].
Don’t stop at trial sign-ups either. Track trial-to-paid conversion rates to see if your seasonal offer is effectively turning trial users into paying customers. Also, monitor Average Order Value (AOV) and total orders to understand if the increased volume is offsetting the lower price point. Dan Pannasch from RevenueCat offers a word of caution:
"A lower price may equal more purchases but not necessarily more revenue, and it's not possible to measure the impact of the change accurately via a simple 'yes/no' purchase decision metric" [6].
Another important step? Segment your results by geography and platform. Performance can vary widely across different markets, and this breakdown can provide deeper insights into how your pricing changes are working.
By tracking these metrics, you’ll get a clearer picture of whether your pricing experiment is a success or if adjustments are needed.
Ensuring Statistical Significance
It’s easy to get excited by early data, but resist the urge to call a winner too soon. Initial trends can be misleading. To ensure your results are reliable, aim for a 95% confidence level with a p-value of 0.05 or lower [14].
Run your tests for 2–4 weeks, making sure each variant has at least 1,000 users. This timeframe helps capture weekly patterns and ensures your data is robust [1]. While tools like Google Play Console let you choose confidence levels between 70% and 99%, sticking with 95% is a safer bet [5].
Use a 95% confidence interval to determine the range of your metrics. If zero falls within this range, it means there’s no statistically significant difference between your test variants [14]. Before starting your test, plug your app’s traffic and expected improvement into a statistical power calculator to determine the ideal number of users and test duration [14][15].
Finally, always account for external factors like holidays, competitor promotions, or currency fluctuations, as these can skew your results [1]. Comparing your current performance to historical data from previous seasonal cycles can help you separate real changes from usual seasonal trends [3].
Scaling and Iterating on Winning Pricing Strategies
Once you've nailed down a seasonal pricing strategy that works, scaling it up requires a careful touch. Aggressive expansion might boost revenue in the short term, but it can also backfire, hurting both revenue and customer retention. The key is to scale thoughtfully, just like you approached A/B testing - step by step, while keeping an eye on how the market shifts.
Phased Rollouts of Seasonal Prices
With a validated strategy in hand, roll it out in phases. Start small - maybe with 10% of your audience - to spot any unexpected issues early. If all goes well, expand to 50% to test scalability before rolling it out to everyone. Even after reaching 100%, keep a small control group (5–10%) to continually benchmark performance against your changes[16].
Jakub Chour, Head of Growth at HER, puts it perfectly:
"Even when your test is statistically significant, it doesn't mean it will be a winner until the end of time. Your users will change; your traffic, product, and competition will change"[4].
When introducing price changes, consider "grandfathering" existing subscribers - letting them keep their current rates for a set period. This builds trust and reduces churn. Also, make sure pricing updates happen simultaneously across platforms like iOS, Android, and Web to avoid confusion[1]. And always have a rollback plan ready. If revenue or retention drops noticeably within the first 48 hours, don't hesitate to revert to the previous pricing[1].
This phased strategy ensures your pricing adjustments stay effective and adaptable over time.
Continuous Testing with Mirava
Seasonal pricing isn’t a "set it and forget it" kind of thing. User behavior and market conditions are always shifting, so your pricing strategy needs to evolve too. Once your seasonal pricing is up and running, start planning the next round of experiments. This might include testing different trial periods, tweaking onboarding processes, or tailoring prices for new markets[1].
That's where Mirava comes in. The platform simplifies much of the heavy lifting, like managing localized pricing, mapping pricing tiers, and syncing updates across 150+ countries. Instead of manually adjusting prices in multiple app stores, you can make batch updates in one click and even preview how those changes might impact revenue[1].
A great example of this is Flo, a period tracking app. Between 2024 and 2025, they experimented with lowering prices in Brazil to match local purchasing power. The result? Brazil became their third-largest market, contributing to an 80% growth rate in non-English-speaking regions, compared to 35% in English-speaking ones[17]. This kind of success doesn’t come from luck - it’s the result of structured, ongoing experimentation.
Conclusion
A/B testing transforms seasonal pricing into a precise, data-driven approach that helps you maximize revenue. Instead of relying on guesswork, structured experiments validate critical factors like price points, trial lengths, and promotional bundles. As Jakub Chour, Head of Growth at HER, explains:
"A/B testing is the most effective method of price testing for mobile apps to maximize the value of your existing users" [4].
This method becomes even more crucial as market trends and consumer behaviors shift with the seasons. Pricing should be seen as an ongoing strategy, not a one-time decision. Seasonal changes bring unique challenges and opportunities - think of the urgency during Black Friday, tighter budgets after the holidays, or the specific demands of back-to-school shopping. By tracking key metrics and adjusting strategies accordingly, you can ensure consistent growth over time.
Platforms like Mirava simplify this process by automating regional pricing updates in over 175 countries. With just one click, you can sync changes across iOS, Android, and Web seamlessly [1]. Features like purchasing power parity adjustments and A/B testing guidance help you scale globally with regional pricing while staying grounded in data-driven experimentation.
By combining robust A/B testing with automation tools that handle the complexity, you can take advantage of seasonal revenue spikes while creating a scalable, long-term pricing strategy. As Zoë Castillo from Mirava highlights:
"Pricing isn't guesswork anymore; it's become a science. And if you want to scale your app revenue in 2025, structured pricing experiments aren't optional" [1].
FAQs
How can I choose the best seasonal events for testing my app's pricing strategy?
To pinpoint the best seasonal events for testing your app’s pricing strategy, start by examining major U.S. holidays and moments that typically boost app activity. Think Black Friday, Cyber Monday, Christmas, New Year’s Eve, and Valentine’s Day - these dates often lead to more downloads and higher in-app spending. Depending on your app’s niche, other events might be just as important. For instance, fitness apps tend to perform well in January, dating apps see a surge around Valentine’s Day, and e-commerce apps thrive during big shopping events.
Next, connect these events to your app’s user behavior. Dive into your analytics to spot patterns, like increases in daily active users (DAU) or conversion rates during specific times. This data can help you identify which events naturally drive engagement among your audience.
After identifying the right events, set up your A/B test with clear objectives, such as “boost revenue by 15% during Black Friday.” Define your control and test groups, and run the experiment during the selected timeframe. To get reliable insights, compare the results to a baseline period. It’s also a good idea to repeat the test every year to confirm trends and refine your strategy.
What key metrics should I analyze when evaluating A/B test results for pricing changes?
When reviewing A/B test results for pricing adjustments, it's essential to zero in on metrics that reveal how users respond and how these changes influence your earnings. Here are the key metrics to keep an eye on:
- Conversion rate: This tells you the percentage of users who complete a purchase after encountering the new pricing.
- Churn rate: Tracks the proportion of users who decide to leave your app following the pricing update.
- ARPU/ARPPU: These stand for average revenue per user or paying user, offering insight into how profitable your pricing strategy is.
- Total revenue: Gives you a big-picture view of how the pricing change is affecting your overall income.
- Lifetime value (LTV): Estimates the total revenue a user is likely to generate throughout their time with your app.
By focusing on these metrics, you can gauge the success of your pricing experiments and make informed decisions to boost revenue while keeping your users engaged.
How can I keep my seasonal app pricing strategy effective over time?
To keep your seasonal pricing strategy sharp, it's essential to run A/B tests regularly. These tests help you compare different price points, taking into account user behavior and market trends. Pay close attention to metrics like revenue, conversion rates, and user retention to figure out what pricing approach delivers the best results. Don't forget to factor in things like regional purchasing power, seasonal demand changes, and local market dynamics to stay ahead of the competition.
Tools like Mirava can simplify this process, helping you adjust your pricing efficiently as conditions shift. This way, you can boost revenue while keeping your customers happy.