iOS generates 5× more revenue per user than Android, despite Android dominating global market share. Developers face a trade-off: Android offers scale, while iOS delivers higher earnings. Between 2022 and 2026, iOS captured 77% of new subscription app launches, driven by higher spending power, reliable billing systems, and dominance in high-income regions like North America and Japan. Meanwhile, Android thrives in emerging markets but struggles with lower spending and higher billing failures.
Key Highlights:
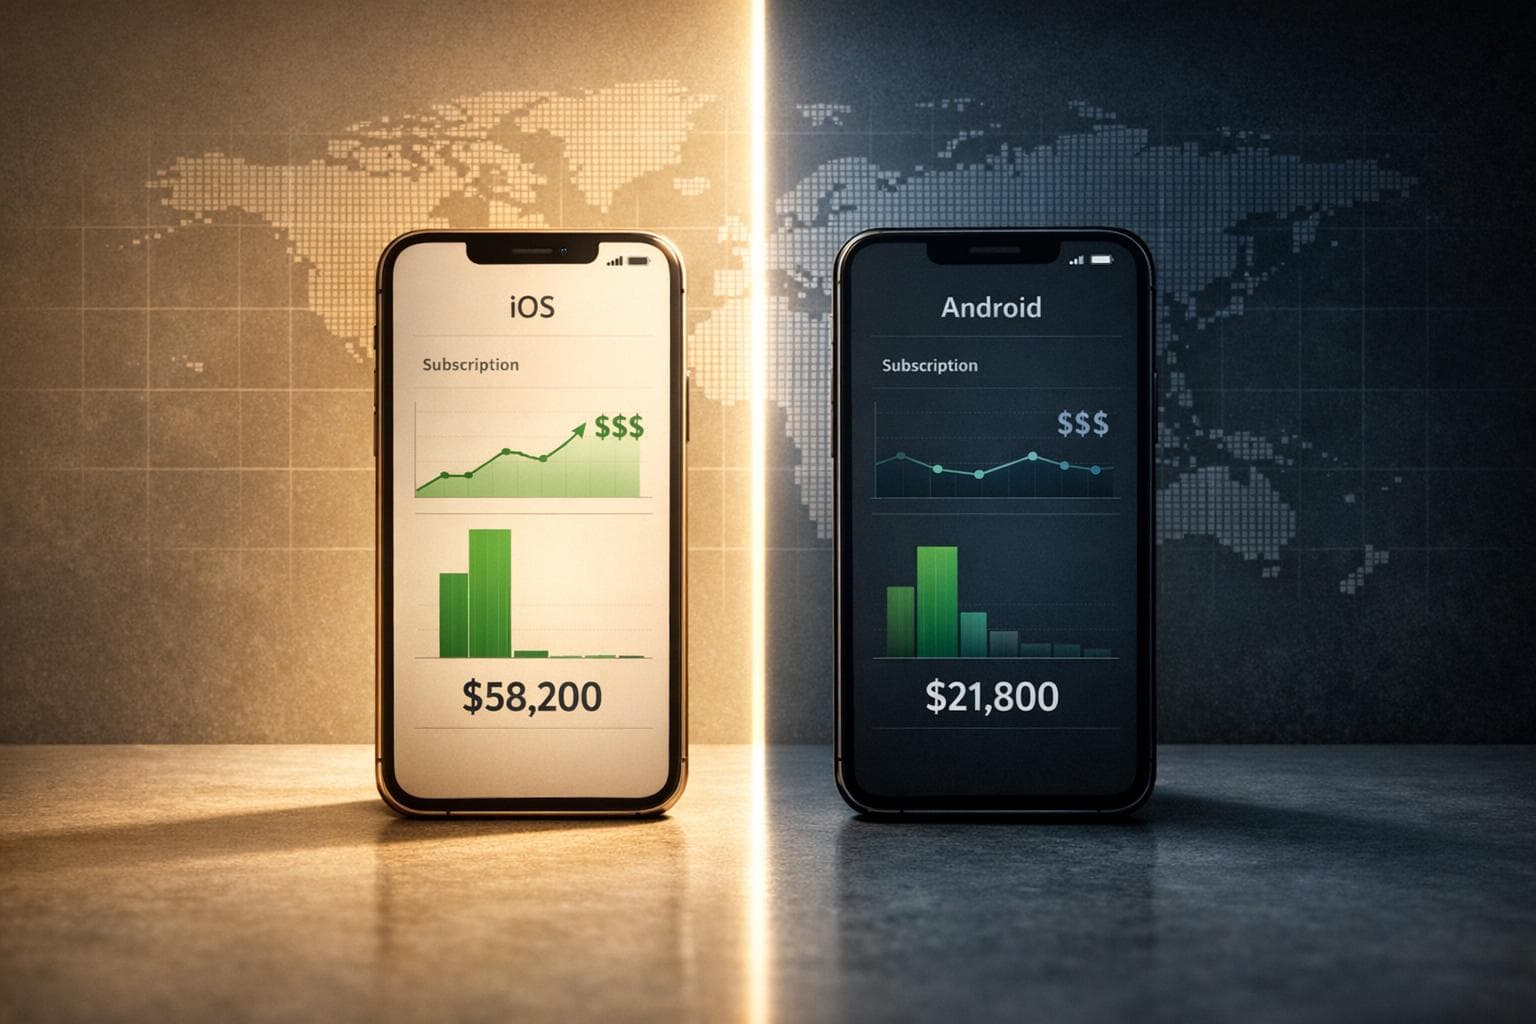
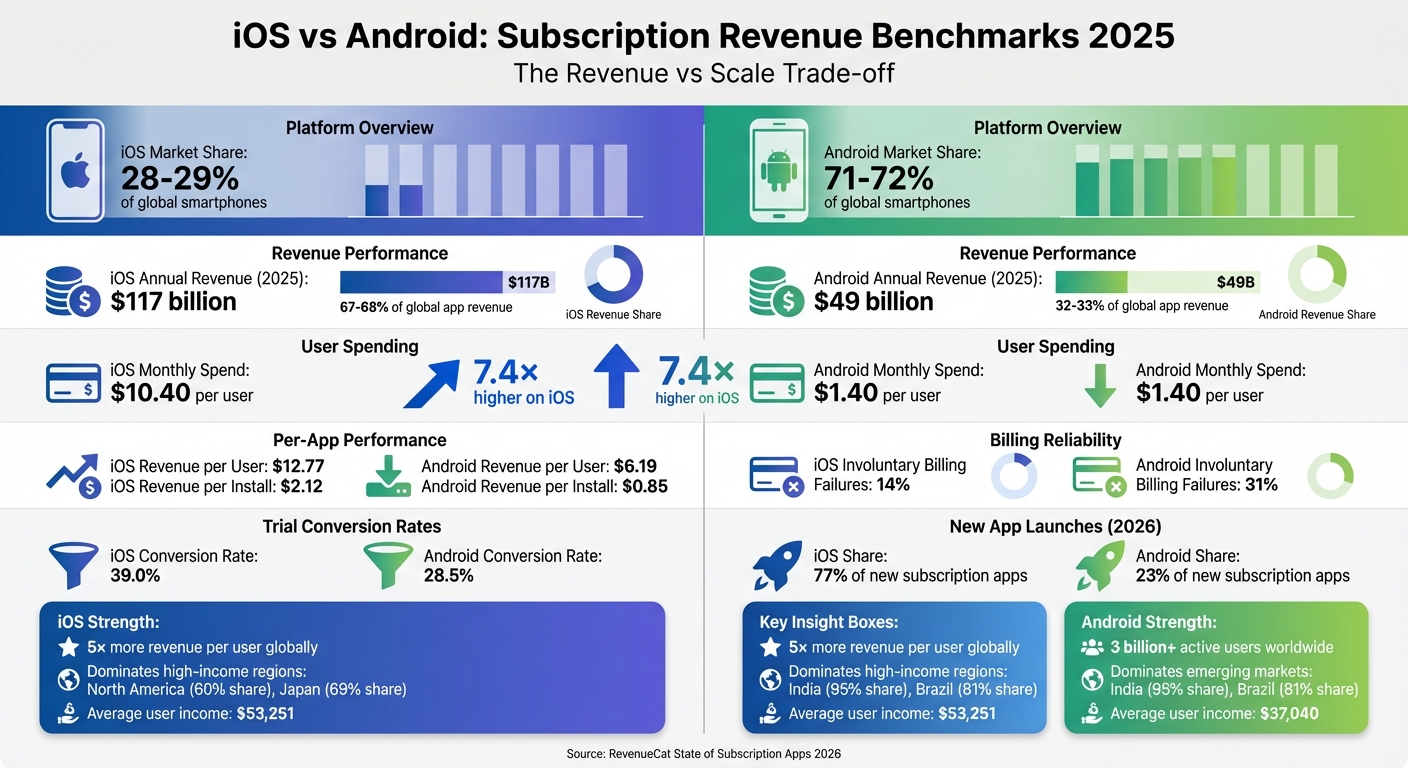
- Revenue Share (2025): iOS ($117B) vs. Android ($49B)
- Monthly User Spend: iOS $10.40, Android $1.40
- Billing Failures: Android 31% vs. iOS 14%
- Top Regions: iOS leads in North America; Android dominates India and Brazil.
- Developer Focus: iOS-first for revenue; Android for scale.
Takeaway: For premium apps, iOS is the clear winner in revenue. Android remains vital for global reach, but monetization requires tackling billing issues and tailoring pricing to regional markets.
iOS vs Android Subscription Revenue Comparison 2025: Key Metrics and Benchmarks
Global Subscription Revenue Overview
Key Global Benchmarks
Despite representing only 28-29% of the global smartphone market, iOS accounts for an impressive 67-68% of global app revenue [5]. In 2022, iOS generated approximately $102 billion of the total $150.1 billion in app revenue, while Android contributed around $48 billion [5]. This means iOS generates more than twice the revenue of Android, even with a smaller share of the market.
Looking ahead, the disparity is expected to grow. Projections show the App Store reaching $161 billion in revenue, compared to Google Play’s $72 billion [4][5]. A closer look at user spending patterns reveals why: iOS users spend an average of $10.40 per month on apps, compared to just $1.40 for Android users [4][5]. That’s a staggering 7.4x difference in spending habits.
Subscriptions are a major driver of iOS revenue, accounting for 73% of its $66.8 billion revenue. On average, iOS apps earn $12.77 per user, almost double Android’s $6.19 [4][5]. These figures highlight iOS’s dominance not only in total revenue but also in per-user and per-app earnings, underscoring key differences in user behavior, economic profiles, and platform ecosystems.
Factors Behind Revenue Differences
To understand why iOS outperforms Android in app revenue, it’s important to examine the factors shaping these trends.
The revenue gap isn’t simply a matter of iOS users being more willing to spend - it’s influenced by demographics, payment infrastructure, and device pricing. iPhone users have an average annual income of $53,251, compared to $37,040 for Android users [4]. This income disparity reflects iOS’s stronghold in high-income regions like North America, where it holds 57-60% market share, and Japan, where its share reaches 68.86%. In contrast, Android dominates in emerging markets such as India (95.16%) and Brazil (81.45%) [4][5].
Payment infrastructure also plays a critical role. Apple requires users to link a credit card to their account, making transactions seamless. On the other hand, Google Play’s optional payment setup introduces friction. As a result, 31% of subscription cancellations on Google Play are due to involuntary billing failures, compared to just 14% on the App Store [2][3]. Independent App Growth Consultant Thomas Petit points out:
It is difficult to sell subscriptions to Android users, particularly due to their regional distribution (large user base in lower purchase power countries) [1].
Device pricing further contributes to the gap. While premium Android users exhibit spending habits similar to iOS users, the majority of Android’s three billion devices are budget models. These users are often as cautious about app purchases as they were about buying their phones [1]. This divergence in device segments directly impacts app revenue potential across the two platforms. Developers can mitigate these platform-specific challenges by implementing strategic regional pricing to capture value across diverse economic profiles.
sbb-itb-43fe43a
iOS Subscription Revenue Benchmarks
Monthly User Spend and Market Share
iOS continues to stand out as a platform with strong monetization potential, supported by user spending patterns and market dominance. On average, iOS users spend $10.40 per month on apps, contributing to 73% of the $66.8 billion global subscription market [4][8]. This spending power significantly boosts developer earnings. Developers can use an app revenue growth estimator to project these returns over time. For instance, in 2025, the App Store generated $117 billion in total revenue, more than double Google Play's $49 billion [6].
When comparing broader tech spending, iOS users shell out $101 per month, nearly twice the $50 spent by Android users. Similarly, Android users spend only $1.40 per month on apps, a stark contrast to iOS's $10.40 [4][8]. This higher disposable income among iOS users fosters a culture more inclined toward recurring payments and premium app pricing, setting the stage for higher per-app revenues.
Subscription App Earnings
Subscription apps on iOS outperform their Android counterparts by a wide margin, earning 87% more per app. iOS apps generate $12.77 per user, compared to Android's $6.19 [4][5]. This pattern extends to revenue per install (RPI), where iOS leads with $2.12, far ahead of Android's $0.85 [8].
Another advantage of iOS lies in its billing reliability. Only 14% of subscription cancellations on iOS are due to involuntary billing failures, compared to 31% on Google Play [7]. This means iOS developers face far fewer revenue losses from payment issues. As Jacob Eiting, CEO of RevenueCat, explains, "addressing billing issues is the new growth hack" for Android developers [7]. This billing stability makes iOS an attractive choice for developers, further solidifying its position as a preferred platform for subscription-based apps.
New Subscription App Launches
iOS is also leading the charge in new subscription app launches, capturing 77% of all global launches, up from 67% in 2023 [7]. Between 2022 and 2026, monthly subscription app launches surged by 7×, reaching over 14,700 new apps per month [7].
The rise of AI-assisted development tools has played a significant role in this growth. According to the RevenueCat State of Subscription Apps Report 2026, "The steepest iOS acceleration begins in early 2025, coinciding with the rise of AI-assisted development tools, which appear to default to App Store-first" [7]. Developers often prioritize iOS because it offers quicker returns on investment, despite the $30,000 to $50,000 development cost for a basic iOS app [5]. This efficiency makes iOS-first strategies increasingly appealing for subscription app creators.
Android Subscription Revenue Benchmarks
Average Monthly User Spend
Android, despite accounting for 15.25% of global subscription revenue [10], serves billions of active users worldwide [4]. On average, Android users spend $1.40 per month on apps, significantly trailing iOS users, who spend $10.40 [4].
This disparity stems from differences in user income levels. Android users have an average annual income of $37,040, compared to $53,251 for iPhone users [4]. Victoria Kharlan from Adapty highlights this stark contrast:
Android has 70% of global mobile users. It captures 15.25% of global subscription revenue. iOS has the rest - a 5.5× revenue differential per subscriber [10].
For Android developers, success hinges on scaling and reaching large user bases rather than focusing on high per-user spending. While individual user revenue is lower, Android’s ecosystem thrives on freemium and ad-supported models, allowing developers to tap into a broader audience.
Growth in Freemium and Ad-Supported Models
Android’s strength lies in its accessibility, with 97.7% of apps on Google Play offered for free, compared to 95.2% on the App Store [4]. This fosters an environment where freemium and ad-supported models excel, particularly in regions with lower purchasing power.
However, freemium models face challenges in conversion rates. By Day 35, freemium apps convert just 2.1% of users, compared to 10.7% for apps using hard paywalls [3]. Revenue per install by Day 60 is $0.38 for freemium apps, significantly lower than $3.09 for hard paywall models [3]. Interestingly, long-term retention rates are nearly identical: 28% for freemium and 27% for hard paywalls after one year [3]. This makes freemium a viable choice for developers prioritizing long-term growth over immediate returns.
One major hurdle for Android developers is involuntary subscription cancellations, which account for 31% of all Google Play subscription churn [3][11]. Jason Lemkin from SaaStr explains:
Nearly a third of all subscription cancellations on Google Play are involuntary billing failures. That's not users choosing to leave - it's payment processing failures causing churn [11].
This issue arises because Google Play does not require users to link a payment method upfront, leading to significant revenue leakage. Developers must address this through improved dunning processes and grace periods to reduce billing-related churn.
Subscription App Launch Growth
The number of subscription app launches on Android has grown significantly, rising from approximately 700 per month in 2022 to 3,300 per month by early 2026 [2]. Despite this growth, Android lags behind iOS, which accounts for 77% of all new subscription app launches globally [7].
This slower adoption reflects Android's monetization challenges, including lower user spending and higher billing failure rates. These factors often push developers toward iOS-first strategies, especially for apps that rely on quick payback periods to fund user acquisition efforts. Still, Android’s unparalleled scale makes it an essential platform for developers aiming for global reach and volume-based revenue strategies.
iOS vs Android Revenue Comparison
Key Metrics Comparison Table
When examining subscription revenue, iOS consistently outpaces Android across nearly all key metrics. Although Android boasts a larger global user base - over 3 billion users - many of whom are in emerging markets with unique pricing needs, iOS secures the lion’s share of subscription revenue [13].
In 2025, the App Store generated a staggering $117 billion in revenue, dwarfing Google Play’s $49 billion. Despite Android’s nearly triple the number of app downloads, iOS maintains a 2.4× revenue advantage [6]. On average, iOS users spend $10.40 per month on apps, significantly higher than the $1.40 spent by Android users [5].
| Metric | iOS (App Store) | Android (Google Play) |
|---|---|---|
| Annual Revenue (2025) | $117 billion [6] | $49 billion [6] |
| Average Monthly User Spend | $10.40 [5] | $1.40 [5] |
| Per-App Revenue | $12.77 [5] | $6.19 [5] |
| Global Subscription Revenue Share | 68% [5] | 32% [5] |
| Trial Conversion Rate | 39.0% [9] | 28.5% [9] |
| Involuntary Billing Failures | 14% [7] | 31% [7] |
| New Subscription App Launch Share (2026) | ~77% [7] | ~23% [7] |
The disparity in revenue isn’t just about spending habits; systemic issues on Android also contribute. Involuntary billing failures are a prime example, with 31% of subscription cancellations on Google Play stemming from payment processing issues - more than double the 14% rate on the App Store [7]. Such failures mean Android developers lose nearly one-third of potential revenue due to unreliable payment systems.
Victoria Kharlan from Adapty highlights the revenue dynamics succinctly:
Every 1% conversion lift on iOS is worth approximately 5.5× the same lift on Android in absolute revenue terms [10].
This revenue potential explains why iOS continues to dominate in the subscription app space. By early 2026, 77% of all new subscription app launches were on iOS, a significant rise from 67% in 2023 [7]. This trend underscores the platform's appeal for developers targeting higher revenue opportunities.
Regional Subscription Trends
iOS Dominance in High-Income Regions
Regional data highlights clear differences in subscription app performance. North America stands out as the most profitable market, with the median Realized Lifetime Value (RLTV) per payer reaching $32 after one year - 40% higher than the global median of $23 [7]. In high-income regions, iOS users consistently spend more, driving higher revenue despite Android's wider user base [5].
In the United States, iOS claims a 59.21% market share, leaving Android with 40.41% [5]. This dominance is reflected in conversion rates: North America sees a median download-to-paid conversion rate of 2.6% by Day 35, nearly double the 1.4% observed in emerging markets like India and Southeast Asia [7]. Western Europe follows closely, with a median RLTV of $25 and a 2.0% conversion rate, though Android holds a 68% market share in this region [7].
Demographics play a key role in iOS's advantage. High-income users - those earning over $50,000 annually - are 60% more likely to choose iOS over Android [5]. This affluent user base contributes to the success of top-performing apps in North America, where the 90th percentile conversion rate reaches an impressive 10.4% [7].
Android Leadership in Emerging Markets
In emerging markets, Android dominates with a 95.16% market share in India and 85% in Africa, thanks to its affordability and widespread availability [5]. Low-cost devices have opened up smartphone access to millions, but monetization remains a challenge. The median annual RLTV in India and Southeast Asia is just $14, less than half the global median [7]. Conversion rates are similarly low, with a median Day 35 rate of 1.4% [7].
Short-term subscriptions are a popular choice in these regions. In India/Southeast Asia, 36% of subscriptions are weekly plans, a figure mirrored in the Middle East and Africa at 35%. These plans align with local spending habits, where users prefer smaller, more frequent payments to match their cash flow [15].
Android developers also face technical hurdles that impact revenue. According to Lorelei Whitman from RevenueCat:
For Android devs, growth is actually an engineering problem... nearly a third of churn isn't because the user hated the app, it's simply because their credit card failed, expired, or was declined [3].
While Android's reach in emerging markets is unmatched, these challenges highlight why its revenue potential lags behind iOS.
The Role of Pricing Intelligence
Tailoring pricing strategies to regional trends is critical for maximizing revenue across platforms. The stark contrast between North America's $32 annual RLTV and India/Southeast Asia's $14 shows why a one-size-fits-all approach doesn't work [7].
In 2025, Mojo found that customizing paywall design - beyond just adjusting currency - led to significant improvements. For example, in Japan, a long-scrolling paywall with social proof outperformed their standard U.S. layout by over 20%. In Latin America, reframing yearly plans as monthly equivalents (e.g., "just $X per month") increased trial starts by 30% and boosted yearly plan adoption by 10% [7].
Mirava leverages purchase data from platforms like Netflix, Spotify, Apple, and YouTube to develop region-specific pricing strategies. By integrating with tools like RevenueCat and Adapty, Mirava determines optimal pricing by region, while these platforms handle billing and paywall management across 170+ countries.
Michal Parizek, Senior Growth PM at Mojo, highlights the missed opportunities in regional paywall optimization:
If your app operates globally, you've likely seen paywall performance vary significantly by region. Yet many teams localize pricing and offers while keeping the same layout, hierarchy, and messaging everywhere. That's a missed opportunity [7].
These insights enable developers to fine-tune their pricing and paywall strategies, unlocking revenue potential across diverse markets.
Monetization Strategies and Tools
Platform-Specific Monetization Approaches
Understanding how to tailor monetization strategies to specific platforms is essential for developers aiming to maximize revenue. iOS and Android demand different approaches due to their distinct user bases and market dynamics.
On iOS, subscription models that require upfront commitment - similar to Netflix - tend to perform well. This success stems from iOS users in high-income regions being more willing to commit to subscriptions immediately. In contrast, Android developers often navigate a different landscape, particularly in emerging markets like India and Southeast Asia. With the median annual revenue per payer at just $14 in these regions, developers must prioritize lower-cost entry points and flexible payment options to better align with local purchasing power [7]. Android also has a higher billing failure rate, which adds complexity and necessitates strong recovery mechanisms to retain revenue.
A major differentiator among apps is the speed at which they experiment with pricing and monetization strategies. Apps running over 50 experiments annually achieve median revenues of $914,734 - nearly 19 times more than those conducting just one experiment [10]. Victoria Kharlan from Adapty underscores this point:
The gap between the top 10% and everyone else isn't primarily a product gap or a pricing gap. It's an experimentation velocity gap [10].
These platform-specific differences highlight the importance of informed, data-driven pricing strategies.
Optimizing Pricing with Mirava
Navigating these monetization challenges requires precise pricing strategies, particularly when targeting global markets. Developers often lose revenue by relying on default pricing or arbitrary regional adjustments, overlooking the fact that willingness to pay can vary by as much as threefold between countries [12].
Mirava steps in as a solution, leveraging data from platforms like Netflix, Spotify, Apple, and YouTube to calculate region-specific prices based on real purchasing behavior in over 170 countries. Acting as an upstream pricing intelligence layer, Mirava determines optimal prices before syncing them with the App Store and Google Play. Developers can preview how pricing changes will impact revenue and conversions, apply psychological rounding techniques, and execute batch price updates across multiple regions.
For teams managing multiple apps or experimenting with regional pricing strategies, Mirava's Professional plan ($25/month when billed annually) offers advanced features like purchasing power parity adjustments and detailed price conversion tools [16].
Complementary Tools for Billing and Paywalls
Once Mirava establishes the ideal region-specific pricing, tools like RevenueCat, Adapty, Purchasely, and Superwall handle execution. RevenueCat, which supports over 115,000 apps, delivers cross-platform subscription management and analytics [7]. Adapty provides a no-code paywall builder, A/B testing capabilities, and a "Refund Saver" feature that recovers up to 73% of lost revenue automatically [12].
These tools integrate seamlessly with Mirava, enabling developers to sync adaptive pricing rules directly through SDKs like those from RevenueCat or Adapty. This setup allows teams to display dynamic paywalls and refine pricing strategies or visual designs without requiring app store updates [14][16].
For Android developers, tackling billing recovery is especially critical. As Jacob Eiting, CEO of RevenueCat, explains:
For Android developers, addressing billing issues is the new growth hack [7].
Features like built-in grace periods and retry logic in tools like RevenueCat can significantly reduce cancellations caused by involuntary billing failures on Google Play, helping developers retain more of their hard-earned revenue.
Key Takeaways for Developers
iOS for Revenue Maximization
When it comes to generating revenue per user, iOS outpaces Android by a factor of 5 globally[1]. For instance, North American iOS developers report a median Day 35 download-to-paid conversion rate of 2.6%, nearly double the 1.4% seen in Android-dominated regions like India and Southeast Asia[7]. As of early 2026, 77% of new subscription app launches are on iOS, a significant jump from 67% in 2023[7]. If your focus is on premium subscriptions and faster ROI, iOS should be your priority.
Hard paywalls perform particularly well on iOS, boasting a 10.7% median trial-to-paid conversion rate, compared to just 2.1% for freemium models[7][3]. This strategy results in 8x higher revenue per install by day 60, making it an excellent choice for apps with a compelling value proposition[3].
Android for Volume and Scale
While Android offers unparalleled reach, scaling effectively on the platform presents unique challenges. With 71% of global mobile users on Android[1], it’s an essential platform for apps banking on network effects, virality, or international growth. In regions like India, Southeast Asia, and Latin America - where Android commands over 80% market share - it becomes indispensable for acquiring a large user base[1].
However, Android faces higher rates of subscription cancellations due to billing issues. 31% of Google Play cancellations stem from involuntary billing failures, more than double the 14% rate on the App Store[7][3]. Jacob Eiting, CEO of RevenueCat, underscores the importance of addressing this:
For Android developers, addressing billing issues is the new growth hack[7].
To recover lost revenue, developers can implement tools like RevenueCat or Adapty, which enable grace periods and retry logic, recovering 15–20% of failed payments[3]. These challenges emphasize the importance of platform-specific strategies and data-driven decision-making.
Importance of Pricing Intelligence
Navigating platform-specific challenges makes pricing intelligence an essential tool for developers. User willingness to pay can differ by 2–3× between countries, yet many rely on default store localization or arbitrary pricing adjustments[12]. For example, Dutch users pay 62% more for weekly plans than U.S. users, while Turkish users pay nearly 3.5× less[12]. These gaps represent untapped revenue potential.
Mirava offers a solution by analyzing real purchasing data from platforms like Netflix, Spotify, Apple, and YouTube to set region-specific prices across 170+ countries. Mirava works upstream of billing tools like RevenueCat, Adapty, Purchasely, and Superwall, helping developers determine optimal pricing by region while those tools handle paywalls and billing. For developers managing multiple apps or testing regional strategies, Mirava’s Professional plan ($25/month billed annually) includes purchasing power parity adjustments and batch updates.
The subscription market is increasingly favoring top performers. The top 25% of apps have seen 80% or more year-over-year MRR growth, while the bottom 25% have experienced declines of over 33%[3]. Leveraging data-driven pricing isn’t just a competitive edge - it’s becoming essential for long-term growth.
iOS vs. Android: The real revenue gap
FAQs
Should I launch iOS-first or Android-first?
Launching on Android first gives you access to a wider global audience, as Android runs on approximately 71% of mobile devices worldwide. On the other hand, iOS tends to deliver higher subscription revenue per user, particularly in premium markets such as the United States, where iPhone usage is notably high.
The choice comes down to your goals: go with Android if you’re prioritizing reach and expansion, or focus on iOS if higher-value subscriptions are your aim. Tools like RevenueCat and Adapty can assist in fine-tuning monetization strategies across both platforms.
How can Android apps reduce billing-failure churn?
Android apps can tackle billing-failure churn by focusing on seamless billing processes and resolving common payment issues, such as declined payments or transaction errors. Quick and effective user support for billing concerns plays a key role in minimizing churn. Tools like RevenueCat and Adapty help manage billing and paywalls efficiently. Meanwhile, upstream pricing intelligence from Mirava refines pricing strategies, enhancing retention and addressing churn linked to billing failures.
What pricing should I use by country?
To effectively set pricing by country, it's essential to account for regional market variations and local consumer spending habits. On iOS, pricing is constrained by Apple's fixed price tiers, offering limited room for customization. In contrast, Android gives developers more control, enabling precise adjustments for regional pricing.
Mirava plays a key role in determining the best price points by analyzing actual purchasing patterns rather than relying on straightforward currency conversions. Tools like RevenueCat, Adapty, Purchasely, and Superwall simplify the implementation process, while Mirava acts as the upstream pricing intelligence layer, helping to optimize revenue across a variety of global markets.