The subscription app market in 2026 is dominated by a few key trends:
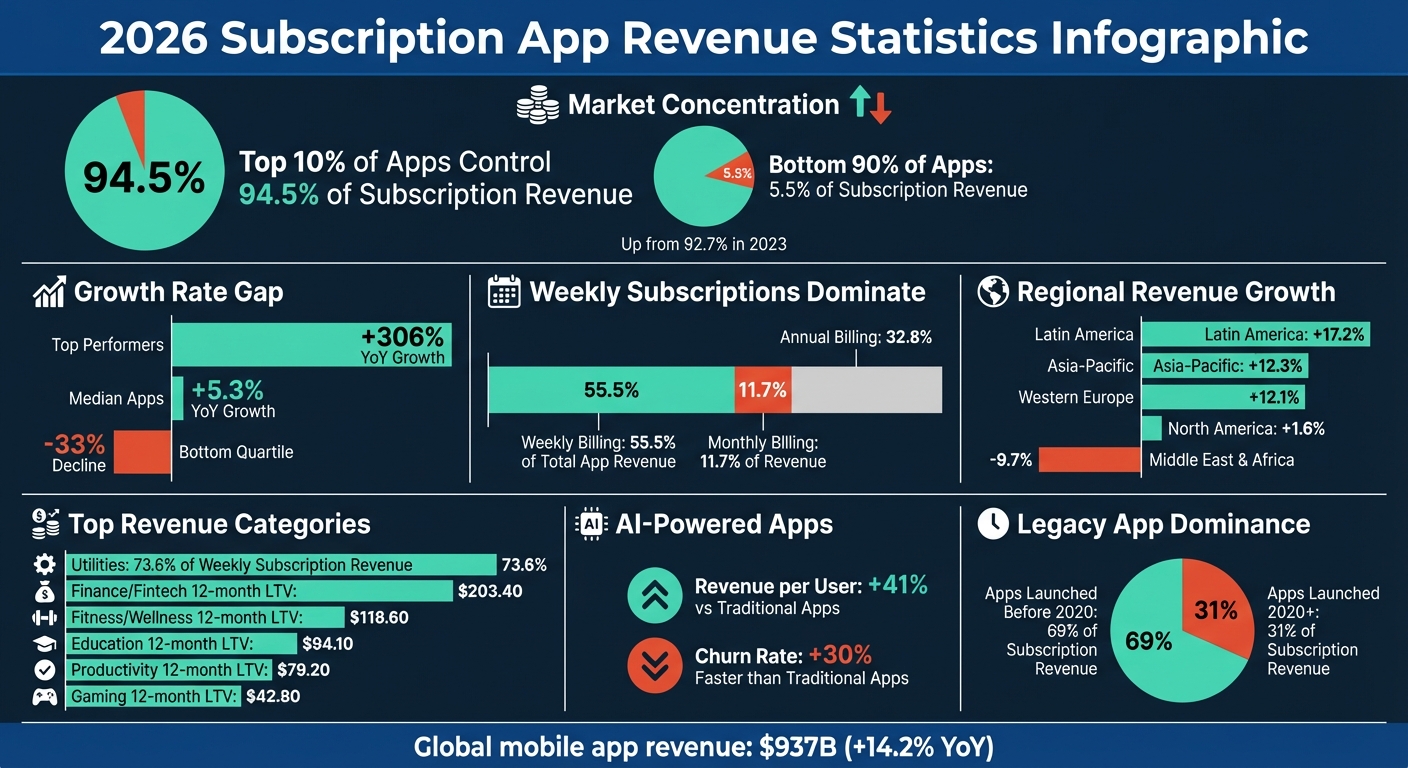
- Market concentration: The top 10% of apps now control 94.5% of subscription revenue, leaving little room for smaller players. Median growth rates remain at just 5.3%, while the top performers see 306% year-over-year growth.
- Shift to weekly subscriptions: Weekly billing now accounts for 55.5% of total app revenue, reflecting consumer demand for shorter commitments.
- Legacy dominance: Despite the surge in new apps, 69% of subscription revenue still comes from apps launched before 2020.
- Category leaders: Utilities, entertainment, and productivity apps lead in revenue, with utilities capturing 73.6% of weekly subscription income.
- Regional differences: Latin America leads in revenue growth (17.2%), while North America lags at 1.6%. Emerging markets increasingly rely on local payment systems like UPI and PIX.
- AI-powered apps: These apps earn 41% more revenue per user but face faster churn, highlighting retention challenges.
Key takeaway: Success in this competitive landscape requires leveraging data-driven pricing strategies, regional pricing, and tools like RevenueCat, Adapty, and Mirava to optimise revenue. Apps that prioritise long-term value over short-term metrics - especially through pricing experiments and tailored billing cycles - are better positioned to thrive.
2026 Subscription App Revenue Statistics: Market Share, Growth Rates, and Category Performance
2026 Global Subscription Revenue Trends
Total Market Size and Growth Rates
By early 2026, global mobile app revenue reached an impressive $937 billion, reflecting a 14.2% year-over-year growth. Yet, this growth tells a story of increasing market concentration. The top 10% of subscription apps now command 94.5% of all subscription revenue, up from 92.7% in 2023 [4]. While these leading apps saw a staggering 306% growth in monthly recurring revenue, the median app managed just 5.3%, and the bottom quartile faced a steep 33% decline [6][7][5]. This uneven growth highlights how competitive dynamics and shifting consumer preferences are reshaping the subscription landscape.
The number of monthly subscription app launches has surged sevenfold, thanks in part to AI-driven development tools. iOS has emerged as the dominant platform for these new launches, accounting for 77% in early 2026, compared to 67% in 2023 [8][11]. However, this influx of apps has created challenges, as noted by Jacob Eiting, CEO of RevenueCat:
"and now we're going to have to process this glut of apps as consumer demand most likely lags" – Jacob Eiting, CEO, RevenueCat [11]
Despite this wave of new entrants, legacy apps launched before 2020 still dominate, generating 69% of total subscription revenue [5][8]. Weekly subscriptions have also gained traction, becoming the top revenue model. By 2025, they accounted for 55.5% of app revenue, up from 43.3% in 2023 [4]. This shift reflects a growing preference for shorter commitment periods among consumers navigating an increasingly crowded marketplace.
Regional Revenue Differences
While global revenue has grown, regional performance varies dramatically. Latin America led the way with a 17.2% median increase in monthly recurring revenue, followed by Asia-Pacific at 12.3% and Western Europe at 12.1% [5][8]. Meanwhile, North America posted modest growth of just 1.6%, and the Middle East & Africa saw a 9.7% decline [5][8].
Regional monetization metrics highlight notable disparities. North American developers achieved a median of $32 per payer after one year, far ahead of $25 in Western Europe, $23 globally, and $14 in India and Southeast Asia [5][8]. Additionally, North America boasted a 2.6% median download-to-paid conversion rate within 35 days, almost double the 1.4% seen in India and Southeast Asia [8]. On the App Store, Japan, Mexico, and Turkey emerged as standout markets, with subscription revenue growth rates of 88%, 82%, and 70%, respectively, in 2026 [3].
Platform-specific dynamics also shaped revenue outcomes. Despite Android holding 70% of the global mobile user base, it accounted for only 15.25% of global subscription revenue [4]. A key driver of this gap is involuntary churn - 31% of cancellations on Google Play stemmed from billing failures, compared to just 14% on the App Store [5][8]. In emerging markets, success increasingly hinges on integrating localized payment systems like UPI in India, PIX in Brazil, and OVO in Indonesia, which cater to regional consumer behaviors better than traditional credit card systems.
sbb-itb-43fe43a
Must Know Subscription App Trends for 2026
Highest-Earning App Categories
After examining global revenue trends, it’s clear that certain app categories lead the charge in subscription monetization for 2026.
Top Categories by Revenue Share
Utilities, Entertainment, and Productivity dominate the subscription-based app market, particularly in the weekly billing segment. Utilities alone contribute a staggering 73.6% of weekly subscription revenue[3]. This success is tied to their ability to solve high-priority problems - services like VPNs, cloud storage, and device optimization tools offer immediate and measurable benefits, making recurring payments easier for users to justify.
While mobile gaming continues to lead in overall revenue, with projections hitting $126.06 billion globally in 2026[12], its revenue model leans heavily on in-app purchases rather than subscriptions. Approximately $81.8 billion of this revenue is expected to come from consumable in-app purchases (IAPs)[13]. On the other hand, finance and fintech apps, though less frequently downloaded, deliver unparalleled per-user value. These apps boast a 12-month lifetime value (LTV) of $203.40, dwarfing gaming’s LTV of $42.80.
The data underscores a clear pattern: apps that address recurring, high-urgency needs with frequent usage cycles are the most successful in driving subscription revenue. For instance, fitness and wellness apps hold 15.7% of the market share with a 12-month LTV of $118.60, while productivity tools account for 9.8% of revenue with an LTV of $79.20. Notably, apps with hard paywalls see a conversion rate of 10.7%, significantly higher than the 2.1% achieved by freemium models[6].
While these established categories maintain their dominance, emerging niches are beginning to shift the revenue landscape.
Fast-Growing Niche Categories
AI-powered apps have emerged as a standout category in 2026, generating 41% more revenue per paying customer compared to traditional apps[8]. However, this growth comes with a downside: AI apps face 30% faster churn rates[8]. This reflects both the utility these apps provide and the experimental nature of the market as developers tap into rising consumer interest in AI technology.
Health and fitness apps exhibit unique subscription behavior. While the broader market has trended toward weekly billing, fitness apps derive 60.6% of their revenue from annual subscriptions[3]. This reflects users’ perception of these apps as long-term investments in personal growth, which also translates into the highest trial-to-paid conversion rate at 35.0%[3]. Additionally, education apps targeting users aged 13 and older are gaining traction through competency certifications. These apps achieve a 12-month LTV of $94.10 while capturing 7.5% of market revenue.
These trends highlight how both established and emerging categories are reshaping the subscription app economy, driven by evolving user behaviors and market opportunities.
Lifetime Value and Subscriber Metrics by Category
Understanding which app categories excel in retaining users can reveal lucrative long-term revenue opportunities. While download numbers are a key metric, the real measure of success lies in how much value subscribers generate over time. This is where certain app categories shine in the subscription economy.
Categories with the Highest LTV
Finance and fintech apps dominate in terms of long-term revenue, boasting a 12-month LTV of $203.40 - almost five times higher than gaming apps at $42.80. This stark contrast underscores how subscriptions raise app pricing expectations when users perceive tangible financial benefits, such as micro-investing platforms or buy-now-pay-later services.
Fitness and wellness apps also perform well, with a 12-month LTV of $118.60.
Other categories demonstrate solid LTV figures as well. Educational apps designed for users aged 13 and older achieve a 12-month LTV of $94.10, while productivity tools follow closely at $79.20. Utilities apps, addressing practical everyday needs, report a trial user LTV of $68.90 [3].
When comparing app pricing strategies, premium-tier apps significantly outperform lower-priced alternatives. The median annual LTV for premium apps stands at $62.19, compared to just $10.69 for lower-priced offerings [1]. This gap highlights the greater value generated by subscribers who commit to premium tiers.
Retention and churn metrics further illuminate how these categories sustain their user bases over time.
Retention Rates and Churn by Category
Retention rates vary widely depending on the app category and subscription model. After one year, annual trial subscribers retain at a rate of 19.9%, compared to 14.2% for monthly plans and just 5.5% for weekly subscriptions [3]. Despite their lower long-term retention, weekly plans still capture a notable share of overall revenue.
Among app categories, utilities apps lead in first-renewal retention, with a rate of 58.1%. In contrast, health and fitness apps struggle, posting the lowest first-renewal retention rate at 30.3% [3].
"AI-powered apps generate 41% more revenue per customer but people churn 30% faster. Apps that solve that retention problem early will own their category." - Jacob Eiting, CEO and Co-Founder, RevenueCat [14]
Interestingly, apps leveraging AI face a retention challenge. While AI features increase revenue per payer by 41%, they also accelerate churn, with users leaving 30% faster [14]. Early intervention to address retention issues is crucial for these apps to secure their market position. Additionally, 55% of 3-day trial cancellations occur on Day 0, emphasizing the importance of delivering immediate value to users [14].
Platform differences also play a role in churn. For instance, 31% of subscription cancellations on Google Play stem from billing failures, a figure significantly higher than the 14% seen on iOS [14]. This highlights the importance of platform-specific strategies to reduce churn and improve retention.
Pricing Strategies That Maximize Subscription Revenue
Crafting the right pricing strategy means aligning with how users actually spend and considering regional differences. The gap between top-performing apps and the rest often comes down to how well pricing reflects local purchasing habits.
Region-Specific Pricing Based on Purchasing Behavior
Relying on traditional models like GDP or purchasing power parity (PPP) often fails to capture the nuances of digital spending. For instance, while a user in Vietnam might willingly pay for a service like Netflix, they may hesitate to purchase a productivity app priced at Western standards. Research shows that localization efforts - combining translation with currency-specific adjustments - can boost lifetime value (LTV) by 62.3%, compared to a 45.5% increase from simple price changes alone [3][4].
Adding local payment methods, such as PIX in Brazil, UPI in India, or OVO in Indonesia, further reduces checkout friction and improves conversion rates. Platforms like Mirava simplify this process, leveraging data from services like Netflix, Spotify, Apple, and YouTube to tailor region-specific pricing for over 170 countries. Tools like RevenueCat, Adapty, Purchasely, and Superwall then manage billing and paywalls seamlessly.
Countries like Switzerland, Qatar, and Israel consistently top global LTV rankings for subscription apps. Interestingly, subscription pricing in Europe now averages 29% to 39% higher than in North America [3][4][15]. Apps that conduct 50 or more pricing experiments generate 18.7x more revenue than those running just one [4].
While regional pricing sets the stage, the choice of billing cycles can further influence revenue outcomes.
Most Popular Billing Cycles by Category
Weekly subscriptions have surged in popularity since 2023 [3][4], while monthly plans now account for just 11.7% of revenue, marking a steep decline over the past two years [4]. Weekly plans convert installs into trials at an impressive rate of 9.8%, outperforming annual plans (1.8%) and monthly plans (0.3%) [4].
The effectiveness of billing cycles varies across app categories. In Health & Fitness, annual plans dominate, contributing 60.6% of revenue as users see long-term commitment as integral to the experience [3][4]. Utilities apps, on the other hand, thrive on weekly subscriptions, which make up 73.6% of their revenue [3]. Productivity and Education apps often perform better with monthly or annual plans, with 23.5% of trials starting more than 31 days after installation [4].
"The paywall that looks worst on your Day 0 dashboard is the one delivering the best 12-month results."
- Victoria Kharlan, Author, Adapty [4]
Though weekly plans start with lower Day 0 revenue ($7.40) compared to annual plans ($42.08), their long-term performance is striking. By Day 380, weekly plans grow to $54.50 - a 636% increase - while annual plans see a modest 18.6% growth, reaching $49.92 [4]. Prioritizing 12-month LTV over initial Day 0 revenue can make a significant difference in overall earnings.
Top-Grossing Apps by Category in 2026
Leading Apps and Their Revenue
The following examples highlight how well-crafted monetization strategies can drive market leadership across various app categories.
Google One led the charts as the top-grossing app in the United States in 2025, generating an impressive $1.577 billion in revenue[9]. Its success largely stems from leveraging a "fear of loss" approach - users are prompted to upgrade to paid storage plans as their free storage nears capacity, ensuring they can safeguard important files like photos and documents[9].
TikTok secured $1.375 billion in revenue by combining advertising with in-app purchases[9]. This dual strategy showcases how blending multiple revenue streams can amplify overall earnings.
In the education category, Duolingo achieved over 10 million paid subscribers in Q1 2025, reflecting a 38% year-over-year growth[2]. Features like streak incentives and gamified reminders have proven effective in converting free users into paying customers. Meanwhile, in entertainment, Spotify reached approximately 290 million premium subscribers by the end of 2025. Its focus on personalization has not only justified subscription price increases but also bolstered user retention[2].
Key Takeaways for App Developers
Here’s what app developers need to know based on the latest insights.
The subscription app market in 2026 is heavily concentrated, with 95% of all revenue coming from the top 10% of apps - up from 92.7% in 2023 [15]. Success hinges on more than just product quality; it’s about frequent experimentation. Apps running 50+ experiments generate 18.7x more revenue than those running just one [4].
Weekly subscription plans are leading the pack, now accounting for 55.5% of all app revenue [15]. However, judging weekly plans solely on Day 0 metrics can be misleading. Victoria Kharlan from Adapty highlights this point:
"The paywall that looks worst on your Day 0 dashboard is the one delivering the best 12-month results" – Victoria Kharlan, Author, Adapty [4]
Adding a free trial to weekly plans dramatically increases their 12-month LTV by 636%, from $7.40 to $54.50 [15].
Localized pricing offers the most impactful results among optimization strategies. Combining language translation with currency adjustments lifts LTV by 62.3%, surpassing the 45.5% boost from standard price tweaks [3][4]. Tools like Mirava specialize in region-specific pricing by analyzing purchasing behavior in over 170 countries. Platforms like RevenueCat and Adapty then handle billing, paywalls, and entitlements downstream.
Free trials perform differently across app categories. For instance, they increase LTV by 85.1% in Utilities but reduce it by 21.2% in Lifestyle apps [4][15]. Sven Jürgens, an app growth consultant, explains:
"Trials are a quality filter in some categories and a churn magnet in others" – Sven Jürgens, App Growth Consultant [15]
This underscores the importance of tailoring strategies to your audience instead of relying on one-size-fits-all practices.
Prioritize the first session for optimization. With 89.4% of all trial starts happening on Day 0 [3][4], the onboarding-to-paywall flow is critical. Hard paywalls outperform freemium models in conversion rates, achieving 10.7% compared to just 2.1% [5][6], making them the quicker route to monetization for new apps.
These findings highlight how agile testing and region-specific pricing can be game-changers for subscription success.
FAQs
Why do weekly subscriptions generate so much revenue in 2026?
Weekly subscriptions are projected to generate strong revenue in 2026, thanks to their adaptable billing cycle that appeals to users seeking short-term commitments. This approach often leads to improved conversion rates and increased overall earnings, particularly when combined with pricing strategies tailored to user behavior. Tools such as Mirava and Adapty empower developers to fine-tune pricing by analyzing purchasing habits and user preferences, ensuring maximum returns.
Which app categories have the highest 12-month LTV in 2026?
In 2026, gaming, health & fitness, and entertainment apps rank among the top categories for 12-month lifetime value (LTV). Data from platforms such as RevenueCat and Adapty underscores the robust subscription revenue and high user engagement in these sectors. Their consistent success in monetization stems from their ability to captivate users and maintain strong subscriber retention over time.
How should apps localize pricing and payments by region in 2026?
In 2026, app developers need to prioritize regional pricing and payment adjustments to maximize revenue and enhance user engagement. Instead of basing prices on GDP or PPP, developers should align pricing with local purchasing habits. Tools like Mirava offer detailed pricing insights by analyzing data from leading platforms such as Netflix and Spotify. Meanwhile, solutions like RevenueCat, Adapty, Purchasely, and Superwall handle billing, paywalls, and entitlements, ensuring smooth integration and execution.