Your pricing strategy can make or break your app's success. Here's how to analyze competitor subscription renewal pricing effectively:
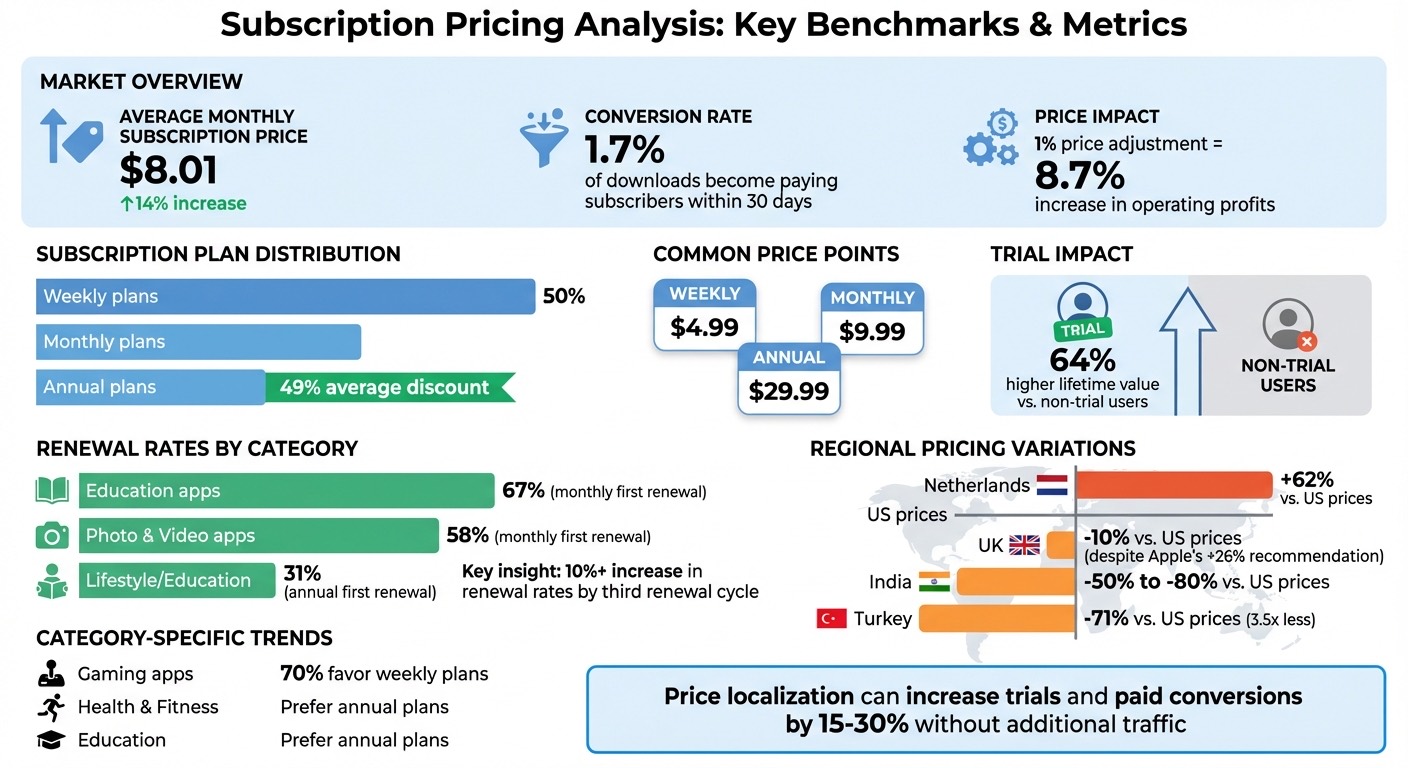
- Understand the stakes: Subscription prices are rising (up 14% to $8.01/month on average), but retention rates are dropping. Balancing these factors is critical.
- Key benchmarks: Weekly plans dominate (50% of subscriptions), while annual plans often come with a 49% discount. Trial users have 64% higher lifetime value than non-trial users.
- Focus on metrics: Renewal rates (e.g., 67% for education apps) and average revenue per user (ARPU) are key to assessing competitor strategies.
- Regional pricing matters: Apps often adjust rates by country. For example, in India, prices can be 50–80% lower than U.S. rates to align with local purchasing power.
- Tools to streamline analysis: Platforms like RevenueCat, Adapty, and Mirava help monitor pricing trends, test adjustments, and optimize regional strategies.
Takeaway: Use competitor data to refine your pricing, test changes, and ensure your strategy aligns with market dynamics. Start by identifying competitors, tracking their subscription models, and leveraging tools for actionable insights.
Subscription Pricing Benchmarks and Key Metrics for App Developers
Identifying Your Competitors and Their Subscription Models
How to Select Competitors
Start by categorizing competitors into three groups: direct competitors (offering identical features), indirect competitors (providing alternative solutions), and market leaders [11]. This approach ensures you're focusing on those actively competing for your users' attention and spending.
Leverage app store rankings and category filters to uncover competitors. Tools like RevenueCat and Adapty can provide additional insights, such as pricing indexes and regional revenue breakdowns by plan type [9]. These resources help pinpoint who dominates in your niche and where your app fits in the ecosystem.
Focus on competitors addressing the same user needs or jobs to be done (JTBD) - the specific problem your app solves for users [3]. For instance, a meditation app competes more closely with other wellness apps than with a streaming service, even if both charge $9.99/month. Monitoring which apps share overlapping keywords in app store searches can further clarify who’s vying for the same user intent [10].
Once you've identified relevant competitors, dive into their subscription models to better understand their pricing strategies.
Understanding Different Subscription Structures
Examining subscription structures provides insights into how competitors position their pricing and communicate value, which directly impacts user retention. Most apps follow one of three models: "Pay to use" (e.g., Netflix), "Freemium" (e.g., Pocket), or "Pay to pay less" (e.g., Amazon Prime) [5].
Pay close attention to how billing intervals and tiered pricing are structured. For example, nearly 70% of gaming apps favor weekly subscription plans, while Health & Fitness and Education apps typically lean toward annual plans. Common price points for these intervals are $4.99 for weekly, $9.99 for monthly, and $29.99 for annual subscriptions [1]. Research suggests that offering three subscription options - weekly, monthly, and yearly - often maximizes lifetime value [9].
Explore competitors’ app listings to identify their plan options, trial lengths (usually 5–9 days), and the timing of their paywall prompts [5] [1]. These details can reveal patterns and strategies that inform your own pricing approach. This often involves testing regional pricing to see how different markets respond to these structures.
sbb-itb-43fe43a
Collecting Data on Competitor Renewal Pricing
Reviewing App Store Listings and Pricing Pages
To start, check the "In-App Purchases" section on App Store product pages. This area typically showcases subscription tiers and their prices, such as introductory offers like "Pay As You Go" (e.g., $1.99/month for 3 months) or "Pay Up Front" (e.g., $1.99 for 2 months) [13].
However, keep in mind that promotional offers tied to win-back campaigns or subscriber upgrades are not displayed publicly. These offers are only visible to existing or former subscribers directly within the app. To get a complete view of pricing strategies, download competitor apps and explore their paywalls. Using a VPN to access local app stores is especially useful for uncovering regional pricing variations:
"The most accurate method for checking prices across markets is to use a VPN to access local app stores directly. This ensures you're seeing current rates rather than relying on price-spying tools, which may not always be up to date" [6].
Additionally, review competitor websites and their Terms of Service for any mentions of "grandfathering" or "preserved pricing" policies, which could mean that existing subscribers are protected from price hikes [14][12]. Bear in mind that price updates on platforms like the App Store and Google Play can take up to 24 hours to fully propagate worldwide, so it’s wise to monitor pricing over a few days for accuracy.
It’s also important to track pricing differences across iOS, Android, and Web platforms, as competitors often employ varying rates and subscription durations depending on the platform [6]. To create a meaningful comparison baseline, build a benchmark index with data from about 10 apps that align with your business model and target audience.
Once you’ve gathered this foundational data, tools can help you monitor pricing changes more efficiently.
Using Tools to Monitor Pricing Changes
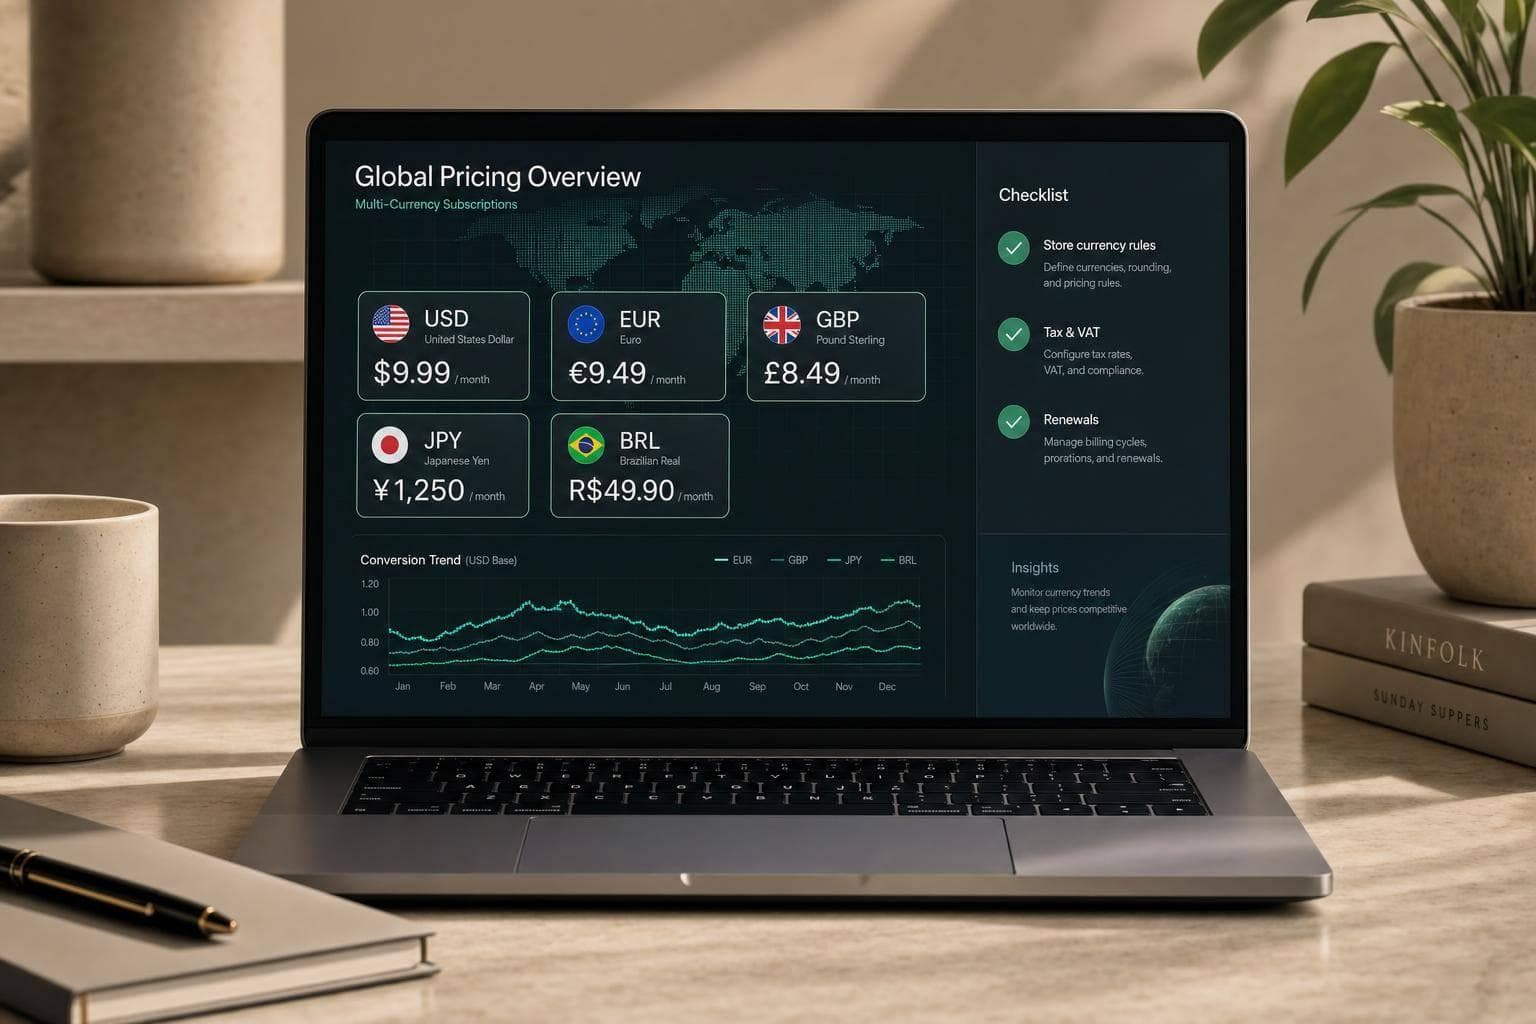
After collecting competitor pricing data, leverage specialized tools to stay updated on market shifts and refine your pricing strategy. Adapty and RevenueCat are particularly useful for tracking changes. For example, Adapty’s Pricing Index, built on $1.9 billion in revenue data from over 11,000 apps, offers country-level benchmarks. This data reveals significant regional price variations, with monthly subscription rates ranging from 62% higher to 63% lower than U.S. pricing [15][8][4].
Other tools like Purchasely and Superwall assist with subscription management and A/B testing for regional price adjustments. These platforms handle billing, paywalls, and entitlements, freeing you to focus on the broader pricing strategy.
For a more advanced approach to regional pricing, consider using Mirava (). Mirava analyzes pricing across iOS, Android, and Web while accounting for factors like currency fluctuations, local purchasing power, and competitive positioning. This ensures your pricing remains both competitive and well-aligned with market trends.
When examining regional pricing, pay attention to deviations from Apple’s default localization recommendations. For instance, in India, Apple suggests pricing 21% lower than U.S. rates, but many successful apps price 50% to 80% lower to better align with local purchasing power [6]. In the UK, while Apple recommends a 26% increase compared to U.S. prices, many apps instead price roughly 10% lower [6]. These variations highlight how competitors balance market penetration with revenue goals, offering valuable insights for your own strategy.
Analyzing Competitor Renewal Pricing Patterns
Important Metrics to Calculate
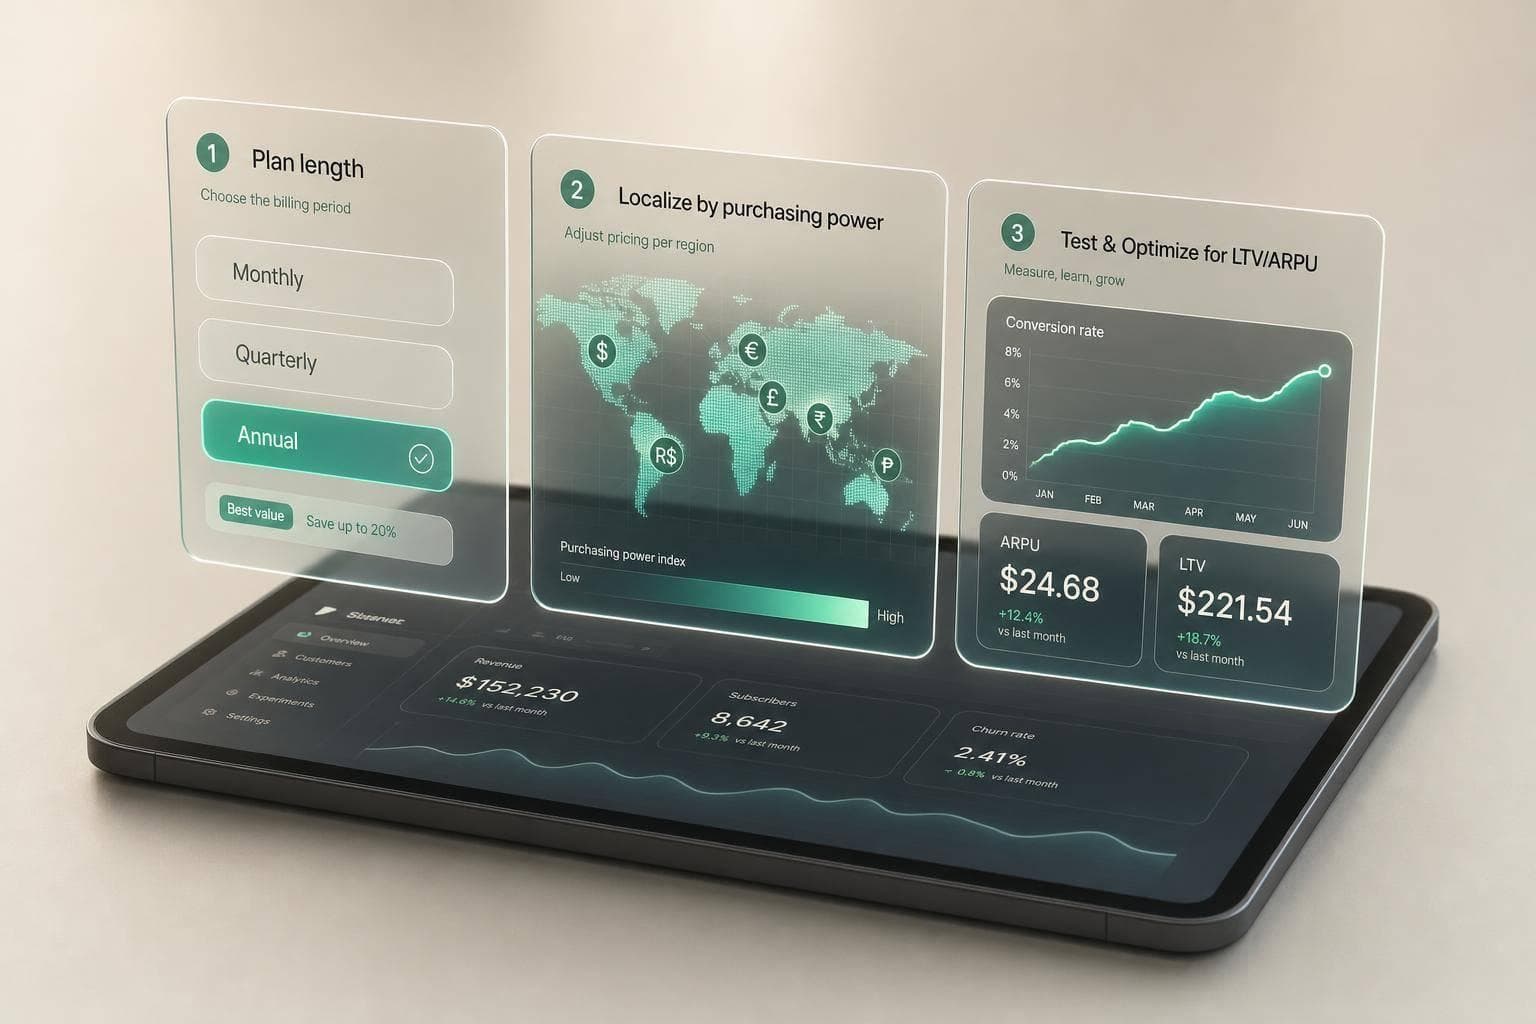
To understand how competitors retain and monetize their subscribers, focus on three key metrics: renewal rates, average revenue per user (ARPU), and pricing tiers. These provide a clear picture of competitor performance in subscription retention and revenue generation.
Renewal rates are calculated as:
(renewed contracts / due contracts) × 100.
This metric reveals the percentage of subscribers who continue their subscriptions after the initial period ends. For example, in June 2024, RevenueCat reported that the median first renewal rate for monthly subscriptions in the Education category was 67%, compared to 58% for Photo & Video apps [2]. Annual subscriptions generally see lower first renewal rates, with Lifestyle and Education apps averaging around 31% [2].
Interestingly, renewal rates tend to improve after the first cycle. Weekly and monthly subscriptions, in particular, experience a more than 10% increase in renewal rates by the third renewal [16]. As Jacob Eiting, CEO & Co-Founder of RevenueCat, explains:
"If you can get users past the first renewal period, they're more likely to stick around for the long haul" [16].
ARPU, another critical metric, is calculated by dividing subscription revenue by the number of users in each tier. The State of Subscription Apps 2024 report noted a 14% rise in monthly subscription prices, providing a useful benchmark for ARPU analysis [1]. Comparing your ARPU against competitors’ can highlight areas where your pricing strategy could be adjusted.
Once these metrics are in place, you can shift to analyzing how competitors use pricing models and discounts to differentiate themselves.
Comparing Pricing Models and Discounts
With the key metrics calculated, the next step is to dissect how competitors structure their pricing. Look at whether they favor flat-rate or tiered models and the discounts they offer for longer subscription commitments. For example, common pricing benchmarks show that 1-month subscriptions are often priced at $9.99, while annual plans average $29.99 [1]. However, shorter-term options are gaining traction - weekly subscriptions have grown by 10% and now make up nearly half of all subscriptions [7].
Regional pricing trends add another layer to this analysis. In the US, weekly subscriptions average $8.10, while in Europe, they average $8.30, reflecting a 12.2% year-over-year increase in the region [7]. The Adapty Pricing Index, which is based on $1.9 billion in revenue data from over 11,000 apps, highlights stark regional differences. For instance, users in the Netherlands pay 62% more for weekly plans compared to US users, while Turkish users pay nearly 3.5 times less [4].
Subscription lengths also reveal shifting consumer preferences. In the US, annual plans average $44.60 but are losing ground to shorter-term options [7]. This trend suggests that users are willing to pay more over time for the flexibility of monthly or weekly plans. Additionally, consider whether competitors offer renewal discounts or maintain lower rates for existing subscribers to reduce churn.
Mirava brings additional clarity to these trends by offering region-specific pricing insights based on actual purchasing behavior. Positioned as the upstream pricing intelligence layer, Mirava complements tools like RevenueCat, Adapty, Purchasely, and Superwall. These partnerships enable you to benchmark your renewal pricing strategies and fine-tune them for maximum effectiveness.
Using Your Findings to Improve Your Pricing Strategy
Comparing Your Pricing to Competitors
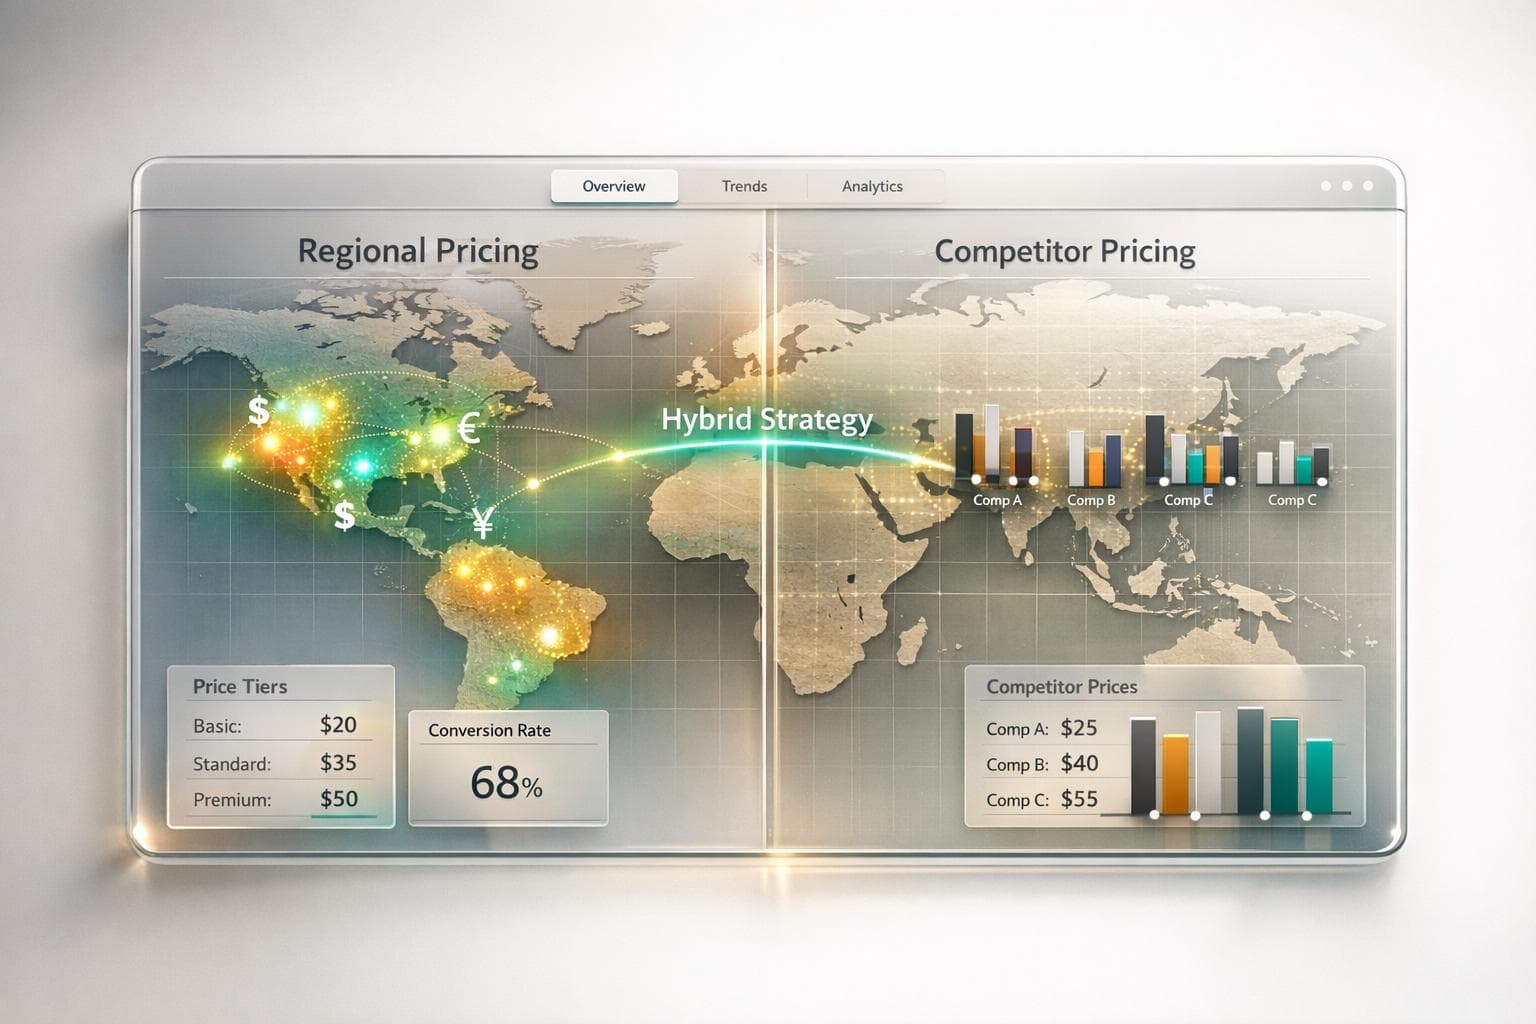
Once you've gathered your data, it's time to stack your pricing against your competitors. A competitor pricing matrix is a great way to do this. Lay out your subscription tiers alongside those of your main competitors, focusing on three key areas: price points, the features included at each tier, and any discounts for annual plans. This comparison can highlight where your pricing might be out of sync with market norms.
For instance, market data shows that annual subscriptions have hovered around $32.53 on average [1]. If your monthly plan is priced at $6.99, you could be undercharging relative to expectations. On the flip side, if you're asking $12.99 when competitors are clustering around $9.99, you’ll need to justify that higher price - perhaps through standout features or a unique value proposition.
Regional pricing differences are another critical factor. In March 2023, Flo made a bold move by slashing prices in Brazil by 50–80% compared to U.S. rates. The result? Brazil quickly became their third-largest market [6]. As Daphne Tideman from RevenueCat points out:
"Every global app should take the time to consider when to start price localization" [6].
Adjustments like these can lead to a 15–30% increase in trials and paid conversions without requiring additional traffic [20].
Don't stop at just the sticker price. Consider the total cost of ownership, which includes implementation fees, hidden charges, or any discount structures. This comprehensive view can reveal weaknesses in your competitors’ pricing models, giving you an edge when fine-tuning your own.
Using Tools to Optimize Your Pricing
After identifying pricing gaps, leverage specialized tools to refine your strategy. Mirava acts as your upstream pricing intelligence layer, using real purchasing data from platforms like Netflix, Spotify, Apple, and YouTube to recommend optimal pricing for each region. With its ability to manage bulk price updates across 175+ countries and preview revenue impacts, Mirava simplifies complex pricing decisions [18][19].
Mirava’s insights are complemented by ecosystem tools like RevenueCat, Adapty, Purchasely, and Superwall, which streamline paywall updates and entitlement management [19]. For example, RevenueCat’s WYSIWYG builder allows you to test variations in pricing and trial lengths, while Adapty’s Growth Autopilot compares your subscription prices to benchmarks derived from $1.9 billion in revenue data [21][22].
Together, these tools eliminate the need for cumbersome spreadsheets and reduce engineering bottlenecks. Dominique Yahyavi from PixelCut shared the benefits of using RevenueCat:
"Being able to find a variant that produces a 16% increase in subscribers definitely makes RevenueCat worth it" [22].
To validate your pricing strategy, try testing adjustments in specific regions. Compare results from high-income markets to those from price-sensitive areas. Label key pricing events - such as currency fluctuations or promotional campaigns - on a timeline to better understand their impact [18]. These incremental tests, guided by your initial competitor analysis, can help you fine-tune your pricing strategy for maximum effectiveness.
Conclusion
Main Takeaways
Understanding competitor subscription renewal pricing goes beyond simply tracking numbers - it’s about uncovering the strategies that drive revenue. Focus on defining a competitive set based on how your customers perceive alternatives, rather than defaulting to the biggest players in your category. By analyzing competitors’ pricing structures, you can determine the total cost of ownership instead of relying solely on headline prices.
Pricing decisions carry significant weight. According to a McKinsey & Company study, even a 1% price adjustment can lead to an 8.7% increase in operating profits, assuming sales volume remains steady. With average monthly subscription prices climbing 14% from $7.05 to $8.01 and just 1.7% of downloads converting into paying subscribers within the first 30 days [1], fine-tuning your pricing strategy has never been more critical. This underscores the importance of tracking pricing trends over time to identify shifts in competitor strategies, such as changes in price ceilings or the adoption of usage-based models.
Upstream tools like Mirava can help you determine optimal regional prices by analyzing market conditions. Once your pricing strategy is in place, tools like RevenueCat, Adapty, Purchasely, and Superwall can handle implementation tasks such as paywalls, billing, and entitlements, enabling you to execute efficiently while maximizing revenue potential.
These insights provide a roadmap for crafting a forward-thinking pricing strategy.
How to Start Your Analysis
Now it’s time to put these insights into action. Start by defining your competitive set using win/loss data and feedback from your sales team. Build a multi-channel data pipeline that combines automated monitoring of public pricing pages with insights gathered from your CRM and sales efforts. Pay close attention to regional pricing trends and discount strategies.
To understand your position in the market, calculate your relative price position using this formula:
(your price ÷ average competitor price) × 100. This will help you track your standing over time [17]. Experiment with pricing adjustments by comparing results across high-income and more price-sensitive markets. As Ariel Michaeli from Appfigures aptly notes:
"How you price really matters. Get it right and you'll maximize every other effort that's gone into your app... Get it wrong and you'll diminish them all" [1].
Start small - make incremental adjustments, measure their impact, and let competitor insights guide your pricing experiments for long-term growth.
FAQs
How do I estimate a competitor’s renewal rate without their internal data?
You can gauge a competitor’s renewal rate by leveraging publicly available benchmarks and subscription analytics. Platforms like RevenueCat offer industry reports and retention charts that provide valuable data, while Apple’s peer group benchmarks shed light on performance within specific app categories. By analyzing these resources and comparing your app’s metrics to the benchmarks, you can estimate whether a competitor’s renewal rates are likely performing above or below the industry average, even without having direct access to their internal data.
What’s the best way to track regional price changes accurately over time?
Using a centralized pricing analytics platform simplifies the process of managing app store data and monitoring price changes across different regions. Platforms like Mirava track every pricing adjustment, connect it to essential metrics, and maintain a detailed historical log for deeper analysis. This approach eliminates inconsistencies between platforms, ensuring you have reliable insights at your fingertips. Additionally, staying up-to-date with Apple's pricing tiers and regional benchmarks can help you fine-tune your pricing strategy to reflect current market trends.
How can I test a price increase without hurting churn?
To evaluate a price increase without risking higher churn, leverage A/B testing by splitting users into separate groups and presenting each with different pricing tiers. This approach allows you to assess how changes affect both revenue and retention. Additionally, experimenting with paywall designs can reveal how users respond to pricing adjustments. It's crucial to handle cohort segmentation and data analysis with precision to ensure accurate insights while keeping churn under control and pinpointing the best price for your audience.