Setting app prices globally without adjustments for local purchasing power often leads to lost revenue and poor conversion rates. Using Purchasing Power Parity (PPP) helps align your app's pricing with what users in different regions can realistically afford, ensuring accessibility in price-sensitive markets and maximizing revenue in higher-income regions. Here's a quick breakdown of the process:
- Set a Base Price: Start with a strong benchmark price in your primary market, often the U.S., using analytics to identify what users perceive as fair.
- Gather PPP Data: Use reliable sources like the World Bank or OECD for regional purchasing power insights, and pair this with competitor pricing analysis.
- Build a PPP-Based Pricing Model: Convert your base price using PPP, adjust for local habits, and test multiple price points to find the ideal balance.
- Test and Adjust: Conduct mobile app pricing experiments in each region and refine pricing based on metrics like Revenue Per User (RPU) and churn rates.
- Automate and Monitor: Use tools like Mirava to simplify price updates across platforms and track performance metrics to stay responsive to market changes.
Key takeaway: PPP-based pricing ensures your app is both affordable and profitable across diverse markets. Tools like Mirava, RevenueCat, and Adapty streamline implementation, helping you optimize global pricing with precision.
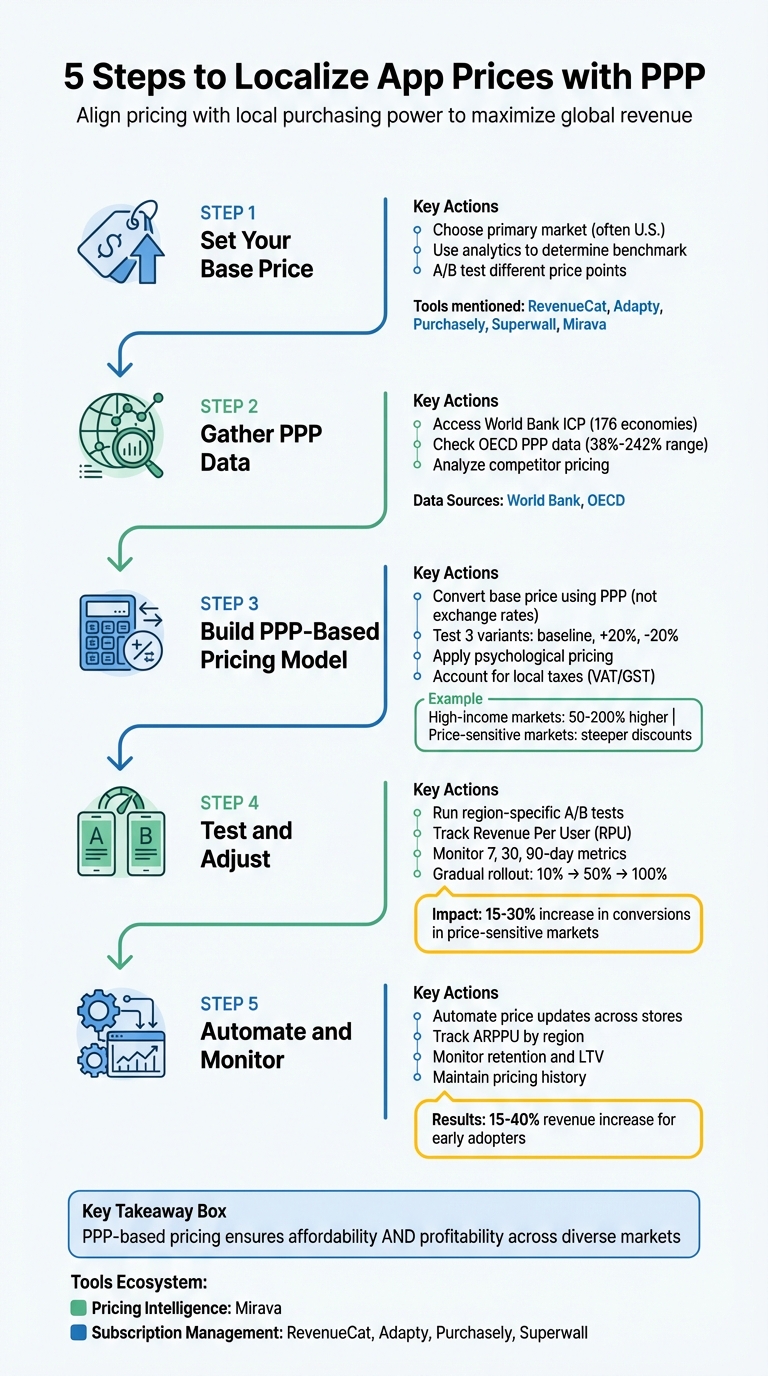
5-Step Process for Localizing App Prices Using Purchasing Power Parity
How to price your subscription app globally - Featuring Jacob Rushfinn
sbb-itb-43fe43a
Step 1: Set Your Base Price in Your Primary Market
Your base price acts as the foundation for regional pricing. Establishing a strong baseline removes uncertainty when adjusting for different regions. Many developers choose the United States as their primary market, as it often accounts for a large share of app revenue and provides reliable pricing benchmarks. A well-defined base price in your primary market creates a solid starting point for applying data-informed purchasing power parity (PPP) adjustments globally.
The key is to strike a balance between maximizing revenue and aligning with what users are willing to pay. This approach lays the groundwork for effective regional pricing strategies.
Use Analytics to Determine Your Benchmark Price
Start by diving into your subscription data. Analytics platforms like RevenueCat and Adapty offer insights into metrics such as conversion rates, trial-to-paid transitions, and revenue per user. Analyze how users interact with your current pricing - pinpoint where they convert and where they abandon the purchase process.
Look for trends in user behavior. Identify which subscription plans perform best, how long customers remain subscribed, and what price points drive higher lifetime value. This data helps you understand what your audience perceives as fair pricing. If you're launching a new app, studying competitor pricing can provide a helpful reference point.
Experiment with Different Price Points
Once you've identified a benchmark price, validate your assumptions through A/B testing. For example, test multiple price points to see which delivers the highest overall revenue. Tools like Superwall and Purchasely simplify the process of creating and tracking different paywall variations across user groups.
While higher prices might reduce conversion rates, they can still lead to increased earnings if revenue per sale rises. Once you’ve pinpointed the most effective base price, you’ll have the foundation needed to apply PPP adjustments for other regions. With your base price confirmed, the next step is to gather local market data to refine your global pricing strategy.
To take this further, consider integrating an upstream pricing intelligence platform like Mirava (). Mirava uses local market insights and purchasing power data to fine-tune regional pricing strategies. It works seamlessly alongside tools like RevenueCat, Adapty, Purchasely, and Superwall, enabling you to optimize pricing across global markets with precision.
Step 2: Gather PPP Data and Market Information
After establishing your base price in Step 1, the next step is to dive into detailed PPP (Purchasing Power Parity) data and market insights. This stage is all about fine-tuning your regional pricing strategy by combining precise economic data with real-world competitor trends.
Use PPP Data for Regional Adjustments
PPP data serves as a benchmark for understanding the relative cost of goods in different countries. It helps ensure your pricing reflects local purchasing power. Reliable data minimizes the risk of setting prices too high, which can deter users, or too low, which can leave money on the table. To strike the right balance, pair PPP insights with competitor pricing to understand both what users can pay and what they are paying.
Finding Reliable PPP Data Sources
For dependable PPP data, consider these key resources:
- The World Bank International Comparison Program (ICP): Covering 176 economies, this is the go-to source for comprehensive PPP statistics. The ICP 2021 results, released in May 2024, include data for 2021, updated figures for 2017, and extrapolated GDP PPPs for 2022 and 2023 [1]. You can access these figures via the World Bank's DataBank, which allows you to search and download specific time series for your target countries.
- OECD Purchasing Power Parities: This resource provides monthly updates on comparative price levels for developed economies. For instance, in 2023, GDP per capita based on PPPs across OECD countries ranged from 38% to 242% of the OECD average, showcasing significant differences even within developed markets. Updates are released regularly, such as on March 2, April 1, May 4, and June 1, 2026 [2].
To convert raw PPP data into actionable app pricing, tools like Mirava can save considerable time. Mirava uses proprietary pricing indexes built on real purchasing behavior from platforms like Netflix, Spotify, Apple, and YouTube. This bridges the gap between macroeconomic PPP figures and actual app subscription pricing, making it easier to align prices with market realities.
Analyze Competitor Pricing
While PPP data helps you understand affordability, competitor analysis reveals what users are already paying. This is where you can refine your strategy by studying how major subscription apps tailor their pricing for different regions. For instance, many apps follow patterns like using rounded price points ($4.99, $9.99) or offering regional discounts compared to U.S. pricing.
Explore the App Store and Google Play in your target markets to identify trends and pricing strategies. Pay attention to common price tiers and any regional promotions. Tools like RevenueCat, Adapty, Purchasely, and Superwall can help you track the impact of pricing changes on conversion rates and revenue. These insights will allow you to position your app competitively while staying aligned with local purchasing power.
Step 3: Build Your PPP-Based Pricing Model
With your base price and PPP data in hand, the next step is to merge economic insights with local market habits. The goal is to use PPP as a foundation while incorporating regional nuances to balance affordability with revenue generation.
Combine PPP with Local Market Data
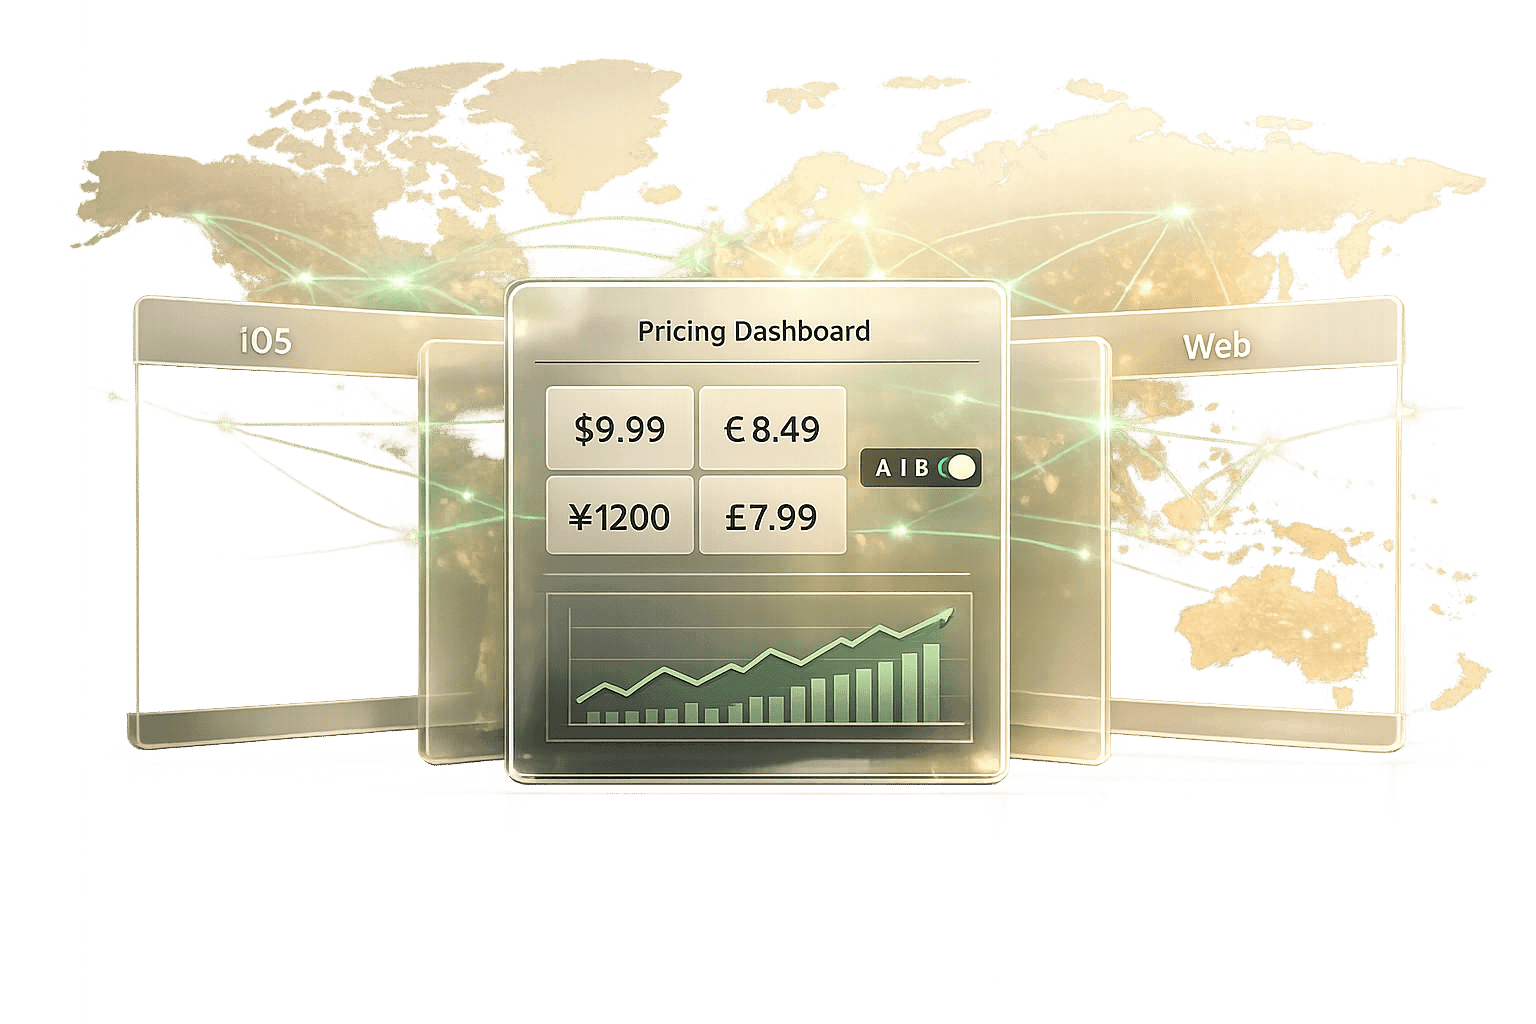
Start by converting your $9.99 base price into local equivalents using PPP instead of straight currency exchange rates. This creates a baseline price that reflects purchasing power. To refine this further, conduct A/B testing with three pricing options: the PPP-calculated price, a 20% higher variant, and a 20% lower variant. Keep an eye on Revenue Per User (RPU) to identify the price point that maximizes both conversions and overall revenue.
Mirava simplifies this process by leveraging proprietary indices derived from actual digital purchasing trends on platforms like Netflix, Spotify, Apple, and YouTube across more than 175 countries. Tools like RevenueCat, Adapty, Purchasely, and Superwall can help you test and validate these regional prices effectively.
Don’t forget to account for local taxes like VAT or GST, as they can affect your profit margins. Also, consider regional spending habits. For instance, factors like payday schedules or heightened activity during local holidays - such as Diwali in India or Golden Week in Japan - can influence when and how users are likely to subscribe.
Once these numerical adjustments are set, focus on refining how the price is perceived.
Use Psychological Pricing
Psychological pricing plays a key role in making your price feel natural in each market. For example, while $9.99 is often more appealing than $10.00 in the U.S., other regions may prefer rounded figures over fractional endings.
"When prices feel 'native,' users convert more. This is not theory - it's consistently proven in subscription behavior." - Mirava [3]
Avoid awkward numbers like $8.47 or €11.23, as they can erode trust. Instead, align your pricing with local subscription norms. In high-income markets like Norway or Switzerland, prices can often be set 50–200% higher than the U.S. base without affecting conversions [3]. On the other hand, markets like India, Brazil, or Turkey typically need steeper PPP-based discounts to remain accessible. Additionally, South American users often prefer rounded pricing patterns, while Southeast Asian markets expect lower subscription prices that reflect local affordability benchmarks [3].
Step 4: Test and Adjust Regional Prices
With your PPP model set up in Step 3, the next move is to put those regional prices to the test and make adjustments. Think of your PPP-calculated price as a well-informed starting point. To refine it, test three price variants in each region: the baseline PPP price, a premium version (+20%), and a discounted version (-20%). This method helps you strike the right balance between affordability for users and maximizing revenue.
Run A/B Tests in Each Region
Conduct your tests on a region-by-region basis to understand local spending habits and market dynamics. This geographic isolation ensures your results accurately reflect the behavior of users in specific regions. Keep a 5–10% control group on the original pricing to provide a benchmark for comparison.
Mirava's real-time intelligence can help pinpoint which price variants to test, while platforms like RevenueCat, Adapty, Purchasely, and Superwall handle the logistics of A/B testing and subscription management. These tools make it easier to execute tests and analyze the results effectively.
Focus on Revenue Per User (RPU) as the key metric to track. In price-sensitive markets, even modest price reductions can lead to a 15–30% increase in trial starts and paid conversions [4]. When you’ve identified the best-performing variant, implement it gradually: start with 10% of users, expand to 50%, and finally roll it out to all users. Avoid testing during major local holidays, as these periods often cause spikes in spending that can distort your findings.
The insights from these tests will guide the next step: refining your pricing based on user behavior.
Adjust Based on Market Response
Once prices are live, closely monitor user behavior across key timeframes - 7, 30, and 90 days. Pay attention to retention rates, time to conversion, and overall conversion rates. If you notice a rise in churn, it could mean your price is perceived as too high for the value offered. These early indicators can help you address pricing issues before they significantly affect your revenue.
Additionally, test region-specific payment options, such as UPI in India or Alipay in China, as these can improve conversion rates. Keep a detailed record of pricing changes by product and country so you can quickly revert to previous prices if needed. On iOS, ensure compliance with Apple's pricing tiers to avoid any issues with store regulations.
Step 5: Automate Price Updates and Track Results
Manually updating prices across app stores is both time-consuming and prone to errors. After refining your regional pricing in Step 4, automating this process becomes crucial to keep your pricing aligned with market changes, such as currency shifts and purchasing power parity (PPP) adjustments.
Automate Price Changes Across Regions
Once you've established your pricing models, automation simplifies the process of applying bulk updates. Without automation, you'd need to log into multiple store consoles and juggle spreadsheets - a tedious and error-prone method. Automation platforms, however, allow you to update store pricing in one streamlined workflow [5].
By connecting to official store APIs, Mirava centralizes your pricing updates across iOS, Android, and Web platforms. This integration lets you adjust hundreds of prices without resubmitting a new app binary. Additionally, tagging price updates in your analytics tools helps you track the impact of changes like currency fluctuations or market shifts [6].
Platforms like RevenueCat, Adapty, Purchasely, and Superwall complement this process by automatically syncing new price metadata once updated at the store level. These tools handle billing logic, paywalls, and entitlements seamlessly, eliminating the need for code changes. In this setup, Mirava determines the optimal pricing strategy, while these platforms manage the operational aspects of subscriptions.
Track Performance Metrics
With automation in place, it's essential to monitor metrics like ARPPU (Average Revenue Per Paying User) by region. This helps identify underperforming pricing tiers in wealthier markets or stagnating conversions in price-sensitive areas [6]. Keep an eye on performance over 7-day, 30-day, and 90-day periods to detect trends early - rising churn, for instance, might signal that your pricing no longer aligns with user value.
Tools like RevenueCat and Adapty provide dashboards to track subscriber retention, lifetime value (LTV), and regional revenue trends. These insights reveal how pricing changes influence long-term subscriber behavior [5]. For example, reducing prices in cost-sensitive markets can boost trials and paid conversions by 15–30% without increasing traffic [4]. Keeping a detailed history of pricing changes allows you to revert to earlier configurations if certain experiments fall short [4].
This ongoing analysis ensures your pricing strategy remains agile and effective over time.
Conclusion
By following these five steps, you can reshape how regional price changes affect app revenue. Using PPP-based pricing ensures your app's rates reflect local purchasing power, helping to drive conversions in cost-sensitive regions while maximizing revenue in higher-income markets. This approach balances fairness with competitiveness.
The steps - starting with setting a base price, collecting PPP data, building a pricing model, testing regional adjustments, and automating updates - offer a structured, scalable method. Early adopters of Mirava have seen revenue increases ranging from 15–40% [7], underscoring the effectiveness of this strategy.
Mirava simplifies pricing management across iOS, Android, and Web by analyzing purchasing data from over 170 countries. Once you've set your pricing strategy, tools like RevenueCat, Adapty, Purchasely, and Superwall can handle billing, paywalls, and user entitlements, ensuring smooth integration from pricing decisions to payment processing.
FAQs
PPP vs exchange rates: which should I use for pricing?
Purchasing Power Parity (PPP) often provides a more effective approach to app pricing compared to relying solely on exchange rates. PPP considers local economic conditions and the affordability of users, ensuring prices are aligned with what people in different regions can reasonably pay. This approach helps avoid overpricing in markets with lower income levels, particularly in emerging economies. On the other hand, exchange rates, while useful for converting currencies, don't account for variations in purchasing power, which can result in pricing that feels out of reach for some users. Platforms like Mirava simplify the process by enabling PPP-based pricing adjustments, ensuring pricing remains fair and accessible across regions.
How often should I re-check PPP prices by country?
There’s no hard-and-fast rule for how often you should revisit PPP (Purchasing Power Parity) pricing, but it’s wise to keep an eye on factors like economic shifts, currency fluctuations, and evolving market trends. Many developers opt to review their pricing either quarterly or twice a year. This approach helps ensure your app's pricing stays aligned with local purchasing power and remains competitive in dynamic markets.
What metrics show PPP pricing works by region?
Key indicators showing the effectiveness of PPP pricing include improvements in revenue, conversion rates, and user engagement. Some apps have experienced revenue growth ranging from 15% to 122% within just a month, with specific regions seeing increases of up to 92.6% over longer periods. Metrics such as lifetime value (LTV) and customer acquisition cost (CAC) further highlight how well localized pricing connects with users, boosting retention and driving international revenue expansion.