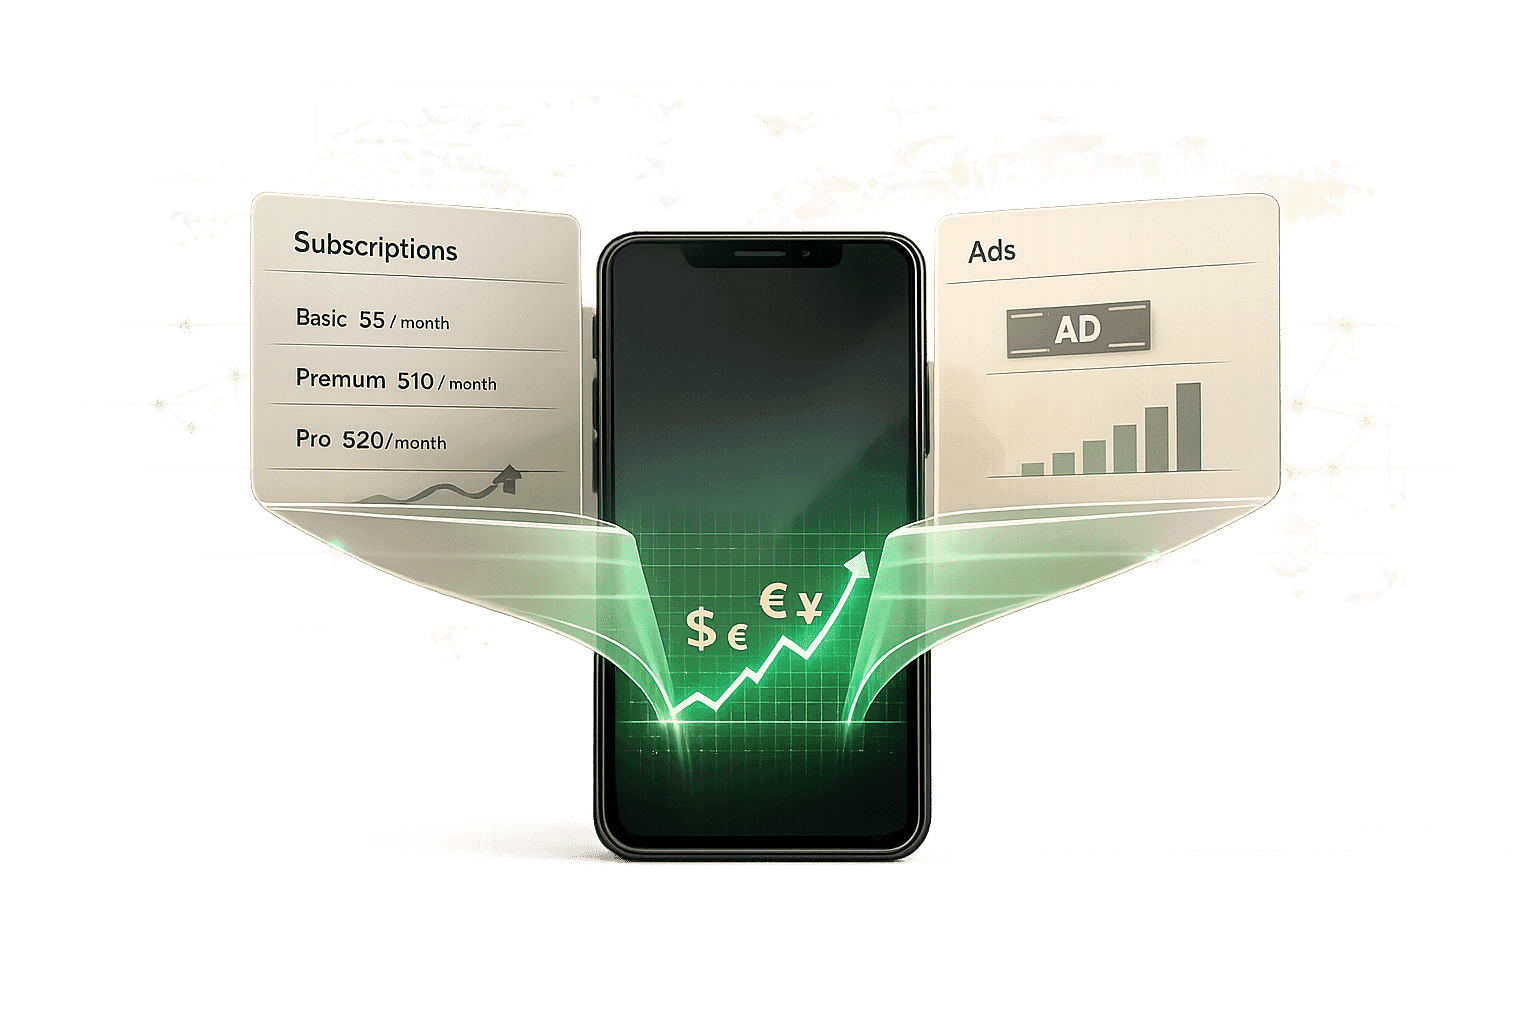
Want to know how much of your app’s market you can realistically reach? Calculating your Serviceable Obtainable Market (SOM) is key. SOM is the portion of your market you can capture soon, factoring in competition, resources, and user behavior. Here's a quick summary of the 5 steps to calculate SOM for your app:
- Start with TAM (Total Addressable Market): Estimate the total revenue potential for your app category using industry reports, competitor data, or market research.
- Narrow it down to SAM (Serviceable Available Market): Apply filters like geography, platform, and demographics to refine TAM into a reachable segment.
- Analyze competition and potential market share: Study competitors and estimate the percentage of SAM your app can realistically achieve.
- Use app-specific metrics: Leverage user data like conversion rates, ARPU (Average Revenue Per User), and retention to refine your SOM.
- Calculate SOM: Multiply SAM by your estimated market share and regional ARPU, accounting for platform fees and local pricing.
Key Tip: Adjusting regional pricing boosts revenue and accessibility for your app. Tools like Mirava can help automate pricing adjustments across countries. It is also essential to test regional pricing to find the optimal price points for each market.
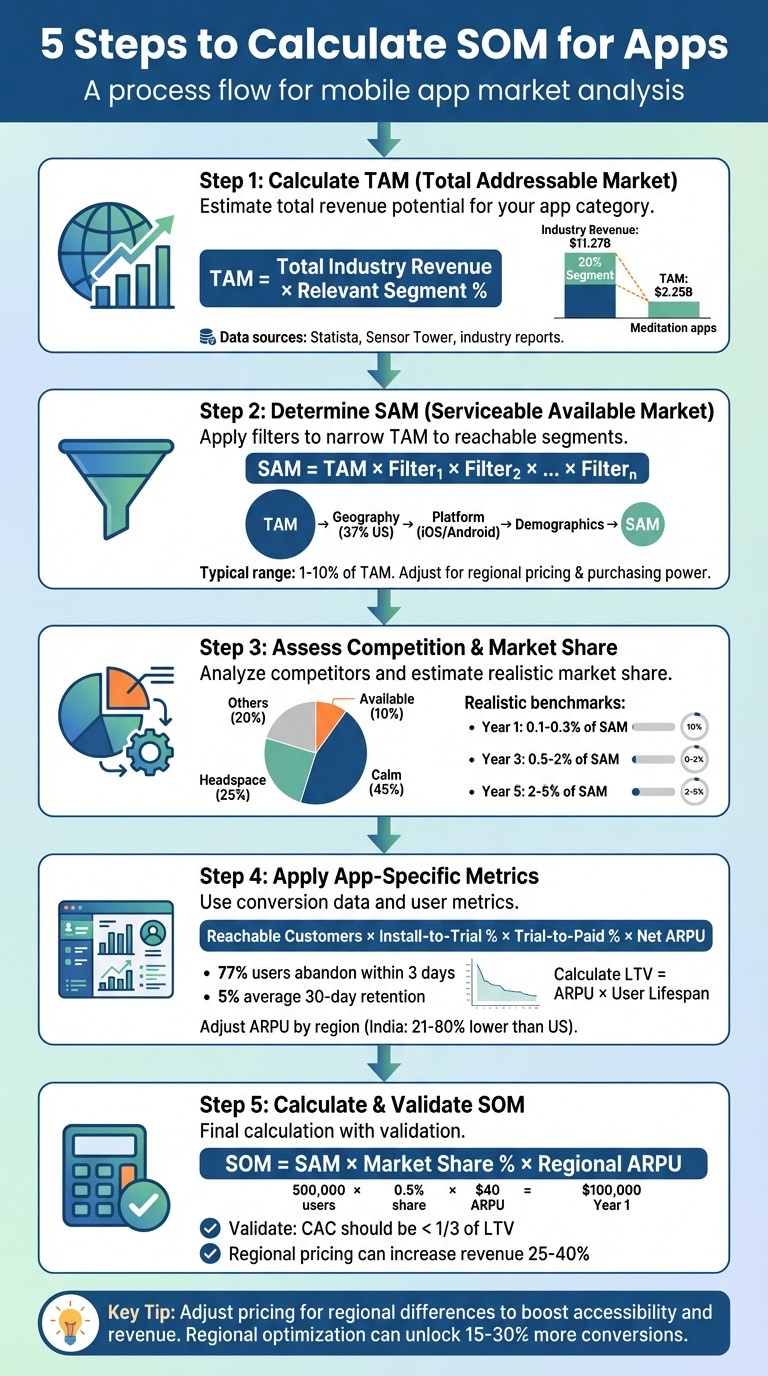
5-Step Process to Calculate SOM for Mobile Apps
Step 1: Calculate Your Total Addressable Market (TAM)
Understanding TAM for Your App Category
TAM, or Total Addressable Market, represents the total revenue potential if your app were to capture the entire target market [3]. It provides the broadest perspective on market opportunity, serving as a starting point before narrowing down to more realistic projections.
To calculate TAM, start by identifying reliable data sources for your app's category. Reports from firms like Statista, Sensor Tower, and Grand View Research often include detailed insights into specific app segments [3]. For instance, the global wellness apps market was valued at $11.27 billion in 2024, with meditation apps accounting for about 20% of that total [3]. Similarly, if you're working on a fitness app, you might refer to the $13.59 billion valuation of the fitness apps market [3].
Public financial filings can also provide valuable insights. Documents like S-1 filings and 10-Q reports from competitors often reveal revenue breakdowns and market share data [6]. Additionally, tools like Google Trends or Ahrefs can help you assess search volume for your app category, offering a glimpse into potential demand [6].
Make sure the data you use is no older than 12–18 months. The mobile app market evolves quickly, and outdated numbers could lead to inaccurate calculations [3]. Once you have your data, refine it using a top-down approach to focus on the most relevant segments.
Top-Down Approach to TAM Calculation
The top-down method uses broad industry data and narrows it down with specific filters. The basic formula is:
TAM = Total Industry Revenue × Relevant Segment Percentage [3].
For example, if your app targets the meditation segment of the wellness market, you’d apply the 20% meditation share to the $11.27 billion wellness market:
$11.27 billion × 20% = $2.25 billion TAM [3]. This figure represents the theoretical revenue ceiling for your app. It gives you a starting point to refine your financial projections with more app-specific data.
It's important to avoid the "1% fallacy", where companies claim they'll capture 1% of a massive market without explaining how they'll achieve that [3]. As Rob Cheng, a startup marketing advisor, explains:
"A few birds in the hand is worth billions in the TAM. Early-stage (pre-Series-B) startups shouldn't worry too much about calculating a precise TAM. As long as it's in the right ballpark for their thesis, investors care a lot more about the traction you can show with paying customers" [6].
To make your TAM estimate more actionable, translate user counts into revenue. Use typical conversion rates (1–5% for freemium apps) and your app's expected ARPU (Average Revenue Per User). This step ensures your TAM calculation is tied to realistic financial outcomes, setting the stage for refining it into SAM and SOM.
sbb-itb-43fe43a
Step 2: Determine Your Serviceable Available Market (SAM)
Applying Filters to Narrow TAM to SAM
After calculating your Total Addressable Market (TAM), the next step is to refine it into your Serviceable Available Market (SAM). SAM represents the portion of TAM that your app can realistically target based on its current features, business model, and reach [3][1]. While TAM gives you the big picture, SAM narrows it down to what’s achievable today. Typically, SAM is estimated to be between 1% and 10% of TAM [3].
To calculate SAM, you’ll need to apply filters that exclude unreachable or irrelevant groups. The formula looks like this:
SAM = TAM × Filter₁ × Filter₂ × ... × Filterₙ [3].
For example, let’s say your meditation app is available only in the United States. First, apply a geographic filter - roughly 37% of the global TAM - which reduces your TAM to about $832.5 million [3]. Then, refine further with platform-specific filters. If your app is iOS-only, you’d exclude Android users, which make up about 56% of U.S. smartphone owners. Additional filters, such as language or age demographics, can further sharpen your SAM to reflect your actual target audience.
Paul Ganev, Vice President of Strategy, Business Development, and Analytics at Surfline, emphasizes the importance of factoring in user commitment during these calculations:
"The flaws come when you start trying to calculate the addressable audience from a modeling standpoint... you're kind of omitting a key factor, which is commitment" [1].
Ignoring this factor can lead to an overestimation of your true audience.
As your app expands to new platforms or regions, your SAM will naturally grow [3][2]. For apps with a smaller SAM, focusing on increasing Average Revenue Per User (ARPU) might be more effective than chasing broader audience numbers [1].
Once you’ve identified your filtered SAM, the next step is to adjust for regional pricing differences to ensure realistic revenue projections.
Incorporating Regional Pricing Factors into SAM
After defining your geographic markets, it’s essential to adjust your SAM based on local purchasing power and economic conditions. For instance, while a $9.99 monthly subscription might work in the U.S., it could be out of reach in lower-income regions [7][1]. Ignoring these differences could inflate your revenue expectations and reduce your app’s accessibility.
To create accurate projections, adjust for local purchasing power, currency fluctuations, and platform fees (which can be as high as 30%) [7][2]. Lowering prices in more price-sensitive markets can yield surprising results - unlocking 15% to 30% more trials and paid conversions without increasing traffic [7].
Tools like Mirava simplify this process by offering per-country price controls that align with Apple’s pricing tiers and local spending power [7]. This eliminates the guesswork of setting prices for international markets and helps protect your margins from currency shifts. Mirava also allows you to test pricing by region without requiring code changes, enabling you to adjust for inflation or currency fluctuations several times a year [7].
Beyond pricing, supporting local payment methods like UPI in India, PIX in Brazil, or BLIK in Poland can significantly expand your SAM [2]. Many users in these regions don’t rely on credit cards, so offering familiar payment options removes barriers and makes your app more accessible to a broader audience.
Step 3: Assess Competition and Market Share Potential
Evaluating Competitors in Target Markets
The first step in understanding your market is identifying your competitors. Focus on two types: direct competitors - apps that offer similar features to yours and target the same audience - and indirect competitors - apps addressing the same user problem but in a different way. You can use app store rankings, category listings, and the "Similar Apps" section to compile your list of competitors [8].
Once you've built your list, group competitors into four categories:
- Market Leaders: These are the top players with the highest downloads and user engagement.
- Direct Rivals: Competitors with rankings similar to yours.
- Emerging Threats: New apps gaining traction quickly.
- Distant Competitors: Apps with lower visibility but potential for growth [8][9].
This categorization helps you focus on the competitors most relevant to your strategy.
Next, dive into each competitor's App Store Optimization (ASO) strategy. Look at their keyword usage and how often they update their metadata. Pay attention to the keywords they bid on in Apple Search Ads - this can provide insight into their acquisition focus and seasonal campaigns [8]. Another valuable tactic is analyzing user reviews, particularly negative ones, to spot recurring complaints. For instance, if users frequently mention issues like a confusing onboarding process or missing features, you’ve uncovered areas where your app can stand out [8][9].
In established markets, dominant players often control a significant portion of the total market share - sometimes as much as 70% to 90% [3]. Take the meditation app market as an example: Calm holds about 45% of the market, Headspace claims roughly 25%, and other established apps account for around 20%. That leaves only 10% of the market available for new entrants [3].
Estimating Your Achievable Market Share
When estimating the share of your Serviceable Available Market (SAM) your app can realistically capture, avoid falling into the "1% fallacy." This is the mistake of claiming you'll capture 1% of a massive market without a clear plan to back it up. Investors often view this as a warning sign [3][5].
Instead, use realistic benchmarks. For most apps, capturing 0.1%–0.3% of SAM in the first year is achievable. By Year 3, this could grow to 0.5%–2%, and by Year 5, 2%–5%. Apps with exceptional performance may exceed these ranges. These projections should be adjusted based on factors like brand awareness, app differentiation, marketing spend, and iOS and Android pricing strategies [5]. Rather than treating these factors as separate considerations, integrate them into your market share estimates.
| Growth Stage | Typical Share of SAM | Exceptional Share |
|---|---|---|
| Year 1 | 0.1% - 0.3% | 0.5% |
| Year 3 | 0.5% - 2% | 5% |
| Year 5 | 2% - 5% | 10% |
"The fastest way to grow your SOM isn't buying more traffic - it's fixing what happens after the click: conversion, payments, retention." - Kristina Margulets, FunnelFox [2]
To validate your estimates, use a bottom-up calculation. Multiply your expected installs by your conversion rates (install to trial, trial to paid) and your Net Average Revenue Per User (ARPU) [2][3]. Keep an eye on your Customer Acquisition Cost (CAC). If it exceeds one-third of your Lifetime Value (LTV), your market share projections may be overly optimistic [3].
Armed with a clear understanding of your competition and achievable market share, you’ll be ready to incorporate app-specific metrics and conversion data in the next step.
Step 4: Apply App-Specific Metrics and Conversion Data
Using Bottom-Up Data for SOM Estimation
To get a precise SOM (Serviceable Obtainable Market) estimate, rely on actual app performance data rather than broad market percentages. Start with this formula: Reachable Customers × Install-to-Trial Conversion Rate × Trial-to-Paid Conversion Rate × Net ARPU [3][2]. By focusing on real numbers from your app's funnel, you can avoid inflated or overly optimistic projections.
Your app's conversion funnel is where the rubber meets the road. Track how users move from installs to trials and, eventually, to paid subscriptions. Include retention rates in your SOM calculations because the drop-off can be steep. For example, 77% of users abandon apps within the first three days, meaning install numbers alone can mislead you [11]. On average, only 5% of users stick around after 30 days, though this figure varies by industry: digital banking apps retain 11.6%, while gaming apps hold onto just 2.3% [13].
To understand each user's revenue potential, calculate Customer Lifetime Value (LTV) by multiplying your ARPU (Average Revenue Per User) by the average user lifespan. This metric shows how much revenue you can expect from each user in your SOM [11]. Another useful metric is the DAU/MAU ratio, which measures how consistently users engage with your app over time. A higher ratio suggests your SOM projections are more likely to hold steady [10][12].
"Understanding your app's retention rate, and how it stacks up to the benchmark rates seen in your vertical and across the larger mobile ecosystem, is an essential part of figuring out your customer engagement and retention strategy." - Todd Grennan, Senior Content Producer, Appboy [13]
Cohort analysis is another essential tool. By grouping users who started using your app during the same period, you can see if product updates or changes are improving retention and, by extension, your obtainable market share [13]. Don't forget to factor in churn - the percentage of users who leave your app over time - as it directly reduces your realistic SOM [11][12].
Adjusting ARPU by Region
Once you've established your SOM using the bottom-up method, refine your revenue estimates by tailoring ARPU to regional differences. A global average ARPU won't cut it, as purchasing power and pricing expectations vary widely. For instance, Apple’s pricing guidelines suggest rates in India should be 21% lower than in the U.S., but in practice, many apps adjust prices by 50-80% to better match local purchasing power [14].
To fine-tune your pricing strategy, benchmark around 10 competitors in each region to create a custom pricing index [14]. Avoid generalized tools like the Big Mac Index, as they lack the specificity needed for app pricing. Remember to calculate net ARPU after accounting for platform fees (15-30%), taxes (VAT/GST), and refund rates [2]. These deductions can significantly impact your revenue.
In regions with lower purchasing power, consider offering shorter subscription plans like weekly or monthly options instead of annual ones. These lower-cost plans reduce the barrier to entry. Take Flo, a period tracking app, as an example: they significantly lowered prices in Brazil, which became their third-largest market. Despite the lower prices, profitability remained high due to reduced customer acquisition costs (CAC) in the region [14].
"If your conversion rate in India is five times lower than in Canada, Australia, or US, well, there's some mismatch... If it's the same as your best converting market, it's unlikely you're going to get a meaningfully higher conversion rate by lowering prices." - Jacob Rushfinn, Founder, Rushfinn Consulting [14]
For a streamlined approach, tools like Mirava can help. Their platform uses purchasing power parity (PPP) data to automate regional pricing adjustments for app subscriptions. With support for over 175 countries, Mirava lets you preview revenue impacts and make batch updates, ensuring your ARPU aligns with local market conditions without the hassle of manual calculations.
Step 5: Calculate and Validate Your SOM
Formula for Calculating SOM
Now that you've refined your SAM using bottom-up data from Step 4, it's time to finalize your SOM (Serviceable Obtainable Market). The formula is straightforward: SOM = SAM × Estimated Market Share × Regional ARPU. Start with your Serviceable Available Market (SAM), estimate the portion you can realistically capture, and multiply by your net Average Revenue Per User (ARPU). Don't forget to account for platform fees, taxes, and refunds when calculating ARPU [3][4].
For instance, if your SAM includes 500,000 potential paying users in North America and you aim for a 0.5% market share in Year 1, that equates to 2,500 customers. With a net ARPU of $40, your SOM would be $100,000 annually. Scaling to a 2% market share by Year 3 would increase this figure to $400,000 [5].
It's crucial to validate this calculation with a bottom-up approach: Reachable Customers × Install-to-Trial Conversion Rate × Trial-to-Paid Conversion Rate × Net ARPU [3]. If there's a significant discrepancy between the two methods - say, a 10× difference - it's a sign to revisit your assumptions about conversion rates or market share [3].
"The more complex you make a model, the more likely you're going to get it to say what you want it to say and the more likely it is to be wrong. Simple is better." - Jacob Eiting, CEO, RevenueCat [1]
Validating SOM with Historical Data and Pricing Tools
Once you've calculated SOM, the next step is to anchor it in reality by comparing it to historical performance. If your app is already live, take last year's revenue and divide it by last year's SAM. This gives you your actual market share, which you can apply to this year's SAM for a grounded projection [15][16]. For new apps, A/B testing on pricing and paywalls can help refine your conversion rate assumptions before locking in your SOM [2].
Revenue analytics tools can simplify this process. For example, Mirava leverages purchasing power parity data to adjust ARPU by region, giving you a clearer picture of revenue potential across 175+ countries. It also supports batch pricing updates and offers A/B testing insights, helping you determine whether a pricing change will positively or negatively impact your market share.
Lastly, double-check your unit economics. Your Customer Acquisition Cost (CAC) should be less than one-third of your Lifetime Value (LTV) to ensure your SOM is achievable within your marketing budget [3]. If the numbers don’t add up, your SOM might be too optimistic, or your acquisition strategy may need a rethink. As Jacob Eiting wisely pointed out, simple models are often the most reliable - if you can't recreate your SOM calculation in one sitting, it might be too complicated to trust [1].
The RIGHT Way to Calculate your Market Size (TAM/SAM/SOM)
Conclusion
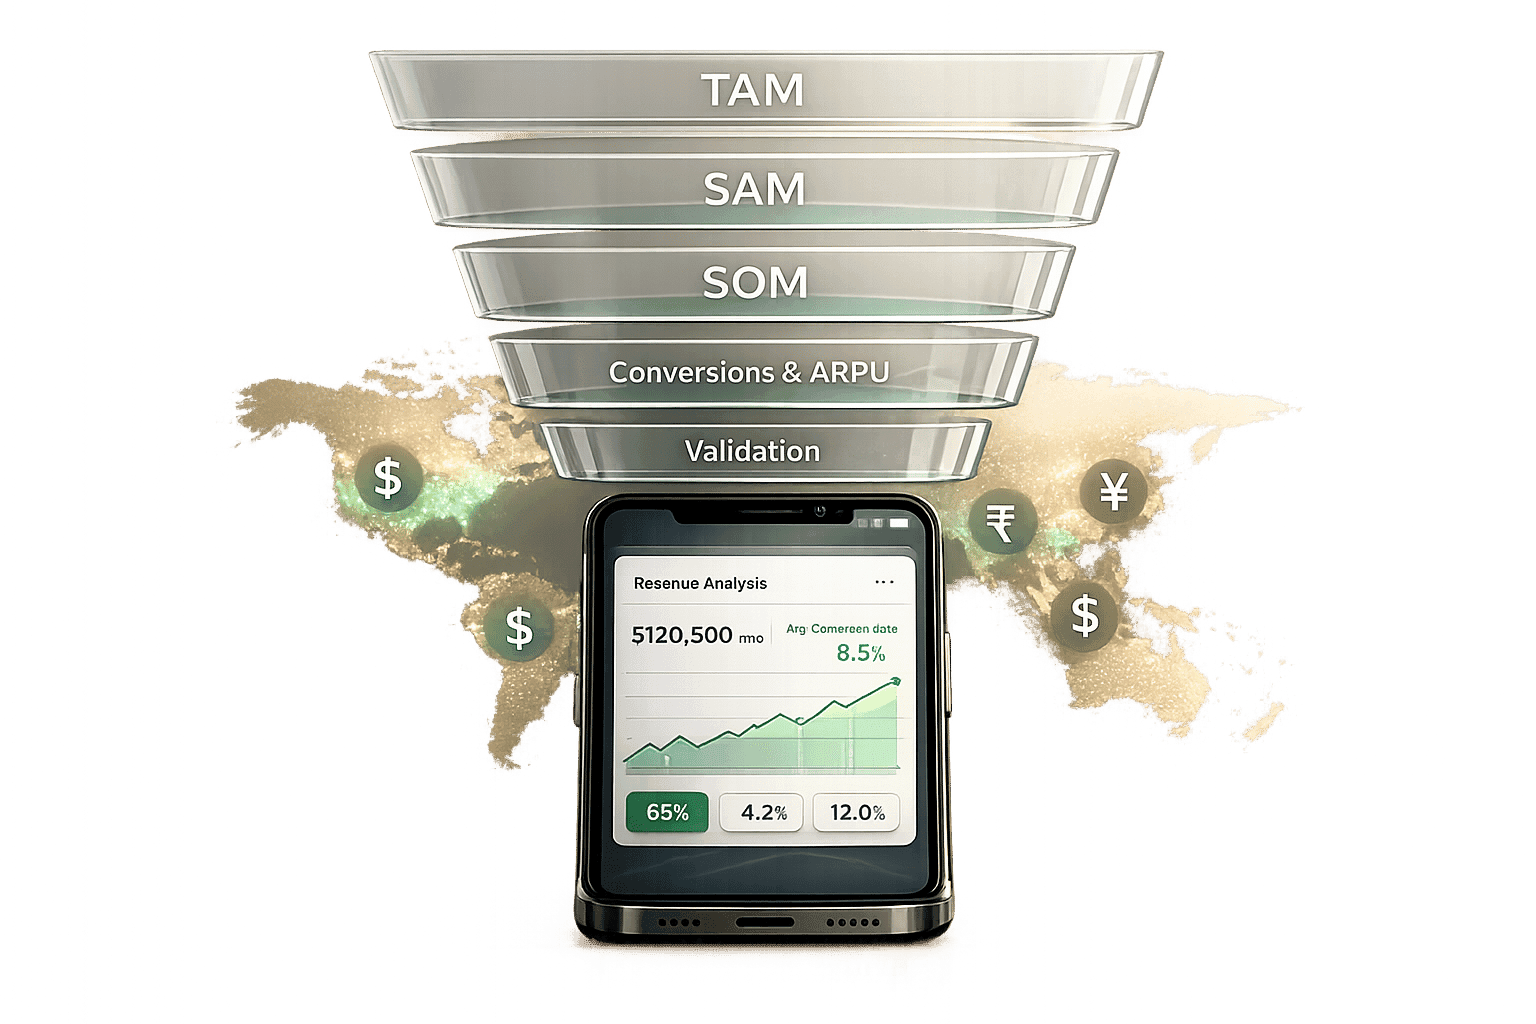
Our step-by-step approach offers a straightforward way to move from TAM (Total Addressable Market) to a focused and realistic SOM (Serviceable Obtainable Market). By calculating SOM, you establish a revenue target grounded in data. Start with TAM, narrow it down to SAM (Serviceable Addressable Market) using geographic and demographic filters, and then refine it further by factoring in competition and conversion rates. The key formula? SOM comes from applying your expected market share and regional ARPU (Average Revenue Per User) to your SAM. For most apps, aiming for a 0.1%–0.3% market share in the first year and scaling to 2%–5% by year five is a solid goal [5].
One common pitfall is treating all markets the same. adjusting prices to reflect local purchasing power can increase revenue by 25–40% [17]. For example, if your app costs $9.99 in the U.S., think about what that price means in regions like India or Brazil - it may need to be adjusted to match local economic conditions.
Tools like Mirava make this process seamless. It automatically adjusts app prices across more than 175 countries based on purchasing power parity. With features like batch updates, A/B testing, and instant rollbacks for underperforming experiments, it eliminates the hassle of manual spreadsheets and guesswork.
These strategies can help you refine your pricing approach and tap into regional markets for meaningful revenue growth.
FAQs
What’s the difference between TAM, SAM, and SOM?
These three terms are all about understanding market potential - but they focus on different levels of scope and practicality.
- TAM (Total Addressable Market): This represents the entire market's revenue potential if your business could hypothetically capture 100% of it. Think of it as the biggest possible pie.
- SAM (Serviceable Available Market): A smaller slice of TAM, this is the segment of the market your business can realistically target based on your products, services, and capabilities.
- SOM (Serviceable Obtainable Market): This is an even narrower focus - it's the portion of SAM you can expect to actually capture in the near term, factoring in your current resources and competition.
These layers help businesses prioritize efforts and set achievable goals while keeping an eye on the bigger picture.
How do I estimate market share for a new app with no data?
To estimate the market share for a new app when you don't have data, you can start with a few practical approaches:
- Analyze product listings and reviews: Look at similar apps in your category. Reviews and ratings can give insights into user demand and satisfaction levels.
- Benchmark industry standards: Research typical market share percentages for apps in your industry to establish a baseline.
- Project potential reach: Consider the size of your target market and estimate the percentage you might realistically capture based on your app's features, appeal, and marketing reach.
These strategies can help you form a rough estimate of your app's potential influence in the market.
How should I adjust ARPU for different countries?
When setting prices for different countries, adjusting ARPU (Average Revenue Per User) to reflect local purchasing power can make a big difference. One effective way to do this is by using Purchasing Power Parity (PPP). PPP helps align pricing with the economic conditions of each region, ensuring that costs feel fair and reasonable to local users.
This strategy not only makes your pricing more competitive but can also lead to better user conversion rates and higher revenue. By tailoring prices to match what people in each market can afford, you create a more accessible and appealing offering for a global audience.