If your app uses one global price, you are likely leaving money on the table. A $19.99/month plan can look normal in the U.S. but far too expensive in India, Brazil, or Turkey, while in Japan a price that is too low can hurt conversion.
I’d boil the workflow down to this:
- Find the markets where downloads are not turning into paid users
- Set local targets using purchasing power, not just FX
- Map those targets to Apple tiers and Google Play country prices
- Keep iOS and Android close in perceived value
- Track conversion, refunds, ARPU, churn, and LTV by country
- Review prices every quarter, or monthly in volatile markets
A few numbers make the case fast. The article shows that a $19.99 subscription can land around ₹1,700–₹1,900 in India through store defaults, while a PPP-based target may be closer to ₹400–₹500. In Brazil, the default can sit near R$100–R$130, while a local target may be closer to R$30–R$40. That gap is big enough to change conversion before your paywall does anything.
I’d also keep one point in mind: price localisation is not only about going lower. In some markets, including Japan, a very low price can signal weak product quality. So the job is not to mirror exchange rates. The job is to match local willingness to pay.
Here’s the core model in one view:
| Step | What I’d do | What to check |
|---|---|---|
| 1 | Pick top countries by downloads and revenue | Conversion, ARPU, retention |
| 2 | Set local targets from a U.S. base price | PPP, local price endings, market norms |
| 3 | Apply store prices | Apple tiers, Google Play overrides |
| 4 | Review results | Conversion, refunds, churn, LTV |
| 5 | Repeat on a schedule | Quarterly for most, monthly for volatile markets |
My takeaway: use Apple and Google Play for price delivery, use RevenueCat, Adapty, or Purchasely for billing and paywalls, and use Mirava upstream to analyse which country-level prices are worth testing before you touch store settings.
If you want a simple rule, start with your top 10–20 markets, fix the countries where paid conversion lags despite solid engagement, and then review the outcome after 7–14 days for early signals and 3–6 months for retention and LTV.
1. Choose Countries and Set Target Local Prices
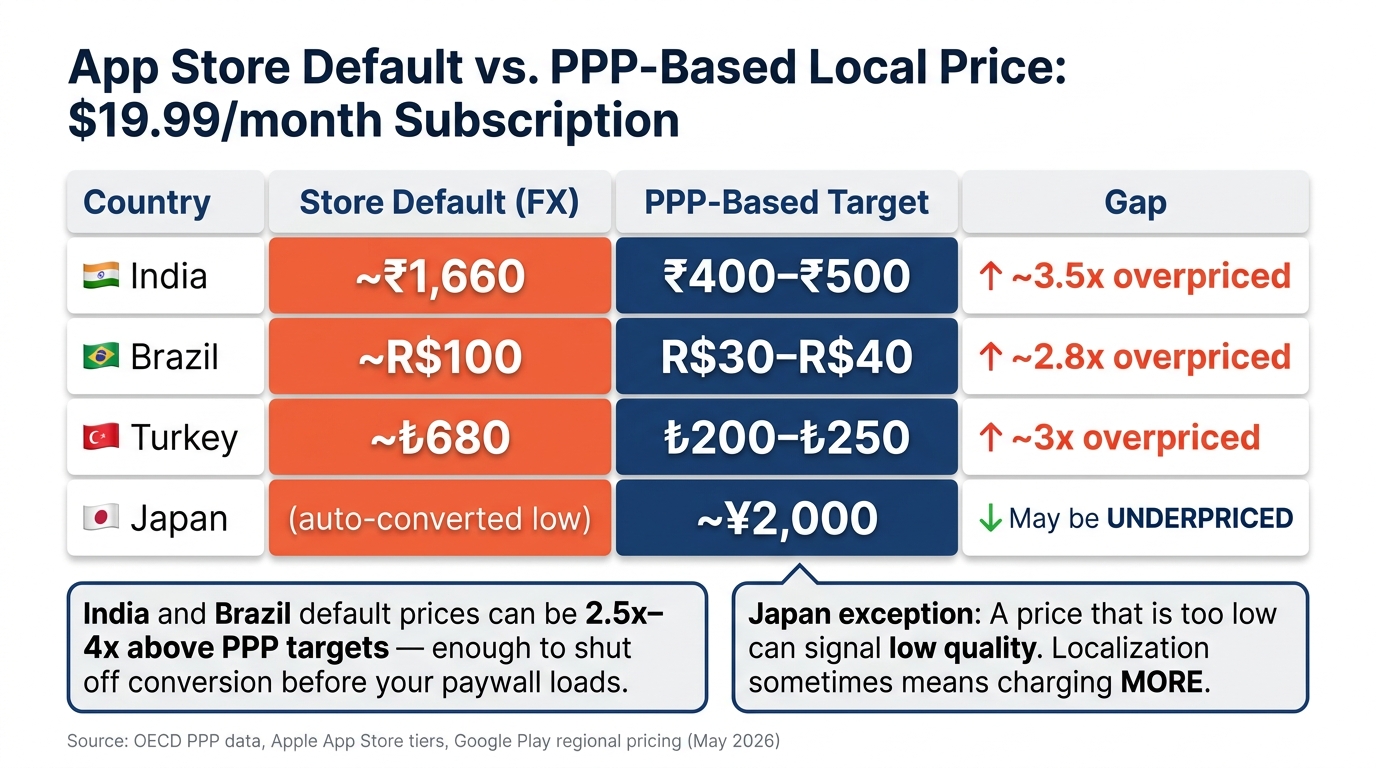
App Store Default vs. PPP-Based Local Prices for a $19.99/Month Subscription
Find the countries where your pricing is likely off
Start with your top 10–20 markets by download volume. Pull country-level data from App Store Connect (Sales and Trends > Territory), Google Play Console, or your subscription stack. Then compare download-to-paid conversion and ARPU across iOS and Android against your U.S. baseline.
What you’re looking for is a big gap between downloads and revenue. That gap often tells you more than topline sales. But don’t jump straight to pricing. First check engagement and retention. If users are active, keep coming back, and still aren’t paying, pricing is the more likely issue than product fit.
RevenueCat reports median Day 60 revenue per install of roughly $0.55 in North America versus $0.11 in India and Southeast Asia [3]. That kind of spread gives you a clear place to start. Once you spot markets with weak paid conversion, you can turn those signals into local target prices instead of relying on store defaults.
Turn a US base price into local target prices
Store auto-conversion solves currency conversion. It does not solve affordability.
A practical starting point is PPP: (PPP_country / PPP_base) × US_base_price. OECD and World Bank ICP data are standard sources for PPP factors [1].
That gives you a baseline you can defend internally. It is not the final number. From there, adjust for local price psychology. In the U.S., .99 endings are common. In India, a point like ₹499 feels normal [1][3]. By contrast, ₹473 looks accidental.
After that, map the target to Apple price tiers and Google Play regional prices. This is where tools like RevenueCat, Adapty, and Purchasely help on billing and paywall delivery, while Mirava sits upstream as the pricing intelligence layer that helps you decide which numbers are worth testing in the first place.
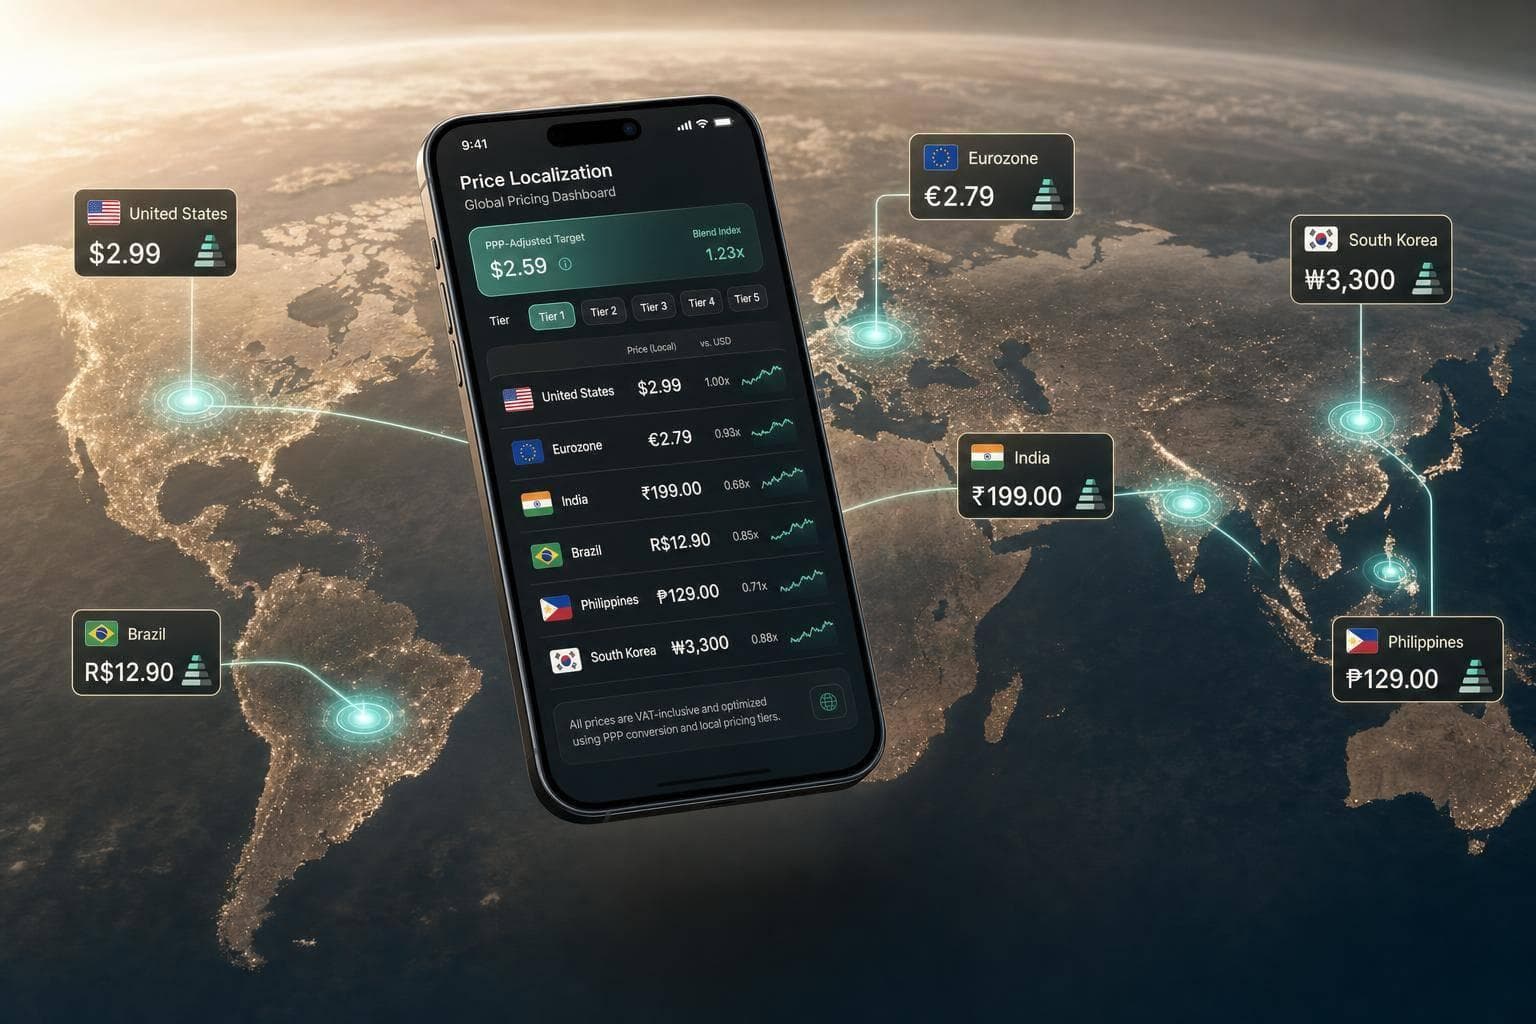
Target price examples for India, Brazil, Turkey, and Japan
A $19.99/month U.S. price can translate into very different local targets.
| Country | Store Default | PPP-Based Target | Psychological Norm |
|---|---|---|---|
| India (₹) | ~₹1,660 [7] | ~₹400 to ₹500 [7] | Ends in 99 or 499; no decimals [3] |
| Brazil (R$) | ~R$100 [7] | ~R$30 to R$40 [7] | .90 endings [3] |
| Turkey (₺) | ~₺680 [7] | ~₺200 to ₺250 [7] | Round tens or twenty-fives [3] |
| Japan (¥) | - | ~¥2,000 [3] | Whole numbers, no decimals [3] |
India and Brazil show the clearest mismatch. The default FX price can land 2.5x to 4x above what PPP analysis points to [7]. That’s not a small pricing miss. It can shut off conversion before the paywall even has a chance.
Flo, the period tracking app, cut prices significantly in Brazil and saw the country become their third-largest market, remaining profitable because local ad acquisition costs are substantially lower than in the U.S. [2]
Japan works differently. Japanese consumers may link very low prices with low quality, so a price in the ¥250–¥600 range can convert better than a very low auto-converted amount [5]. Turkey needs a different kind of caution. High inflation means any target price there should be treated as a starting point, then checked monthly rather than quarterly [4].
The next step is converting these targets into store-specific prices across Apple and Google.
sbb-itb-43fe43a
2. Convert Target Prices into Apple App Store Prices
Set a base USD price and review Apple's default country prices
Once you’ve set target local prices, the next job is mapping them to Apple’s tiers. App Store Connect starts with your U.S. base price and converts that into local storefront prices through Apple’s tier system. That default mapping is useful, but it’s only a starting point.
A $19.99/month U.S. price can auto-convert to about ₹1,899 in India and R$129.90 in Brazil [10]. In many markets, that lands too high. The practical task is to find the tier that gets you closest to your intended local price.
Map target prices to Apple tiers and override by country
Apple only allows preset tiers: $0.10 increments up to $10, $0.50 from $10 to $50, and $1.00 up to about $200 [10]. So if your target prices from Step 1 sit below Apple’s default conversion - which is often the case in markets such as India and Brazil - you’ll need to pick the nearest tier and set it as a country override [9][10].
The table below shows how nearby tiers map across a few key storefronts, using May 2026 data [9]:
| Tier | USD | JPY | INR | BRL | TRY |
|---|---|---|---|---|---|
| Tier 5 | $4.99 | ¥800 | ₹449 | R$26.90 | ₺199.99 |
| Tier 10 | $9.99 | ¥1,600 | ₹830 | R$54.90 | ₺399.99 |
| Tier 20 | $19.99 | ¥3,200 | ₹1,700 | R$109.90 | ₺799.99 |
For India, Tier 5 at ₹449 is far closer to a PPP-adjusted target than Tier 20 at ₹1,700. For Brazil, Tier 5 at R$26.90 is also much closer to a localised recommendation such as R$49.50 than Tier 20 at R$109.90 [9][10]. In practice, this is where pricing teams need to be hands-on: find the tier that best matches your target, then apply it at the storefront level.
One thing to watch: once you manually set a storefront price, Apple stops updating that price for you [10]. From that point on, maintenance is on your side. That’s a big deal in volatile markets such as Turkey, where exchange-rate movement can push your live price away from your intended position pretty fast [1][3].
Check Apple prices before rollout
Before pushing changes live, review every SKU in App Store Connect. Check the local price, the currency display, and whether product-level discounts still make sense. The price ladder between products also needs to stay logical. Your annual plan should still show a clear discount versus monthly in each country, not only in the U.S. [6]
Formatting matters too. Brazil uses a comma as the decimal separator, Japan usually leans on whole numbers, and Turkey often favors rounded endings like the tiers shown above [1][9]. If a price looks odd for the market, users notice. That can hurt trust even when the number itself is valid.
For larger catalogs, App Store Connect’s appPriceSchedules resource with manualPrices updates lets you apply overrides in bulk [8]. Give price changes up to 24 hours to roll out across storefronts before testing on-device [6].
Use the same country targets when you set Google Play prices next.
3. Set Regional Prices in Google Play and Align iOS and Android

Use Google Play's base price, local price suggestions, and country overrides
Use the country targets from Step 2 to set your Google Play prices. In Google Play Console, open each product, check the local price suggestions, and override any country that misses your target [4]. As you do this, follow local rounding norms so the price looks deliberate rather than random. In Japan, that usually means whole numbers like ¥500. In Brazil, endings like R$49.49 or R$49.90 tend to feel normal. In Turkey, rounded figures such as ₺99 often work better than awkward decimals [1][3].
Google Play no longer supports Pricing Templates, so bulk price changes now mean manual work, the Play Developer API, or a third-party pricing tool [4][6]. If you manage a large catalog, that changes the workflow quite a bit. A tool like Mirava helps at the pricing stage by generating country-level targets in advance, so the team isn't working through overrides one by one.
Organize countries into pricing groups
A simple way to manage this is to group countries by purchasing power and set one target price for each tier [3].
| Tier | % of US Price | Example Countries |
|---|---|---|
| Developed | 100% | US, UK, Germany, Japan, South Korea |
| Upper-middle | ~70% | Spain, Italy, Saudi Arabia, Taiwan |
| Mid | ~50% | Brazil, Mexico, Turkey, Thailand |
| Lower-middle | ~35% | India, Indonesia, Vietnam, Egypt |
| Lowest | ~25% | Pakistan, Nigeria, Bangladesh, Tanzania |
Keep your monthly, annual, and any other billing periods aligned so discount ratios stay steady across markets [6]. If annual pricing gives a 30% discount versus monthly in one country, that same logic should carry through elsewhere. Otherwise, the pricing starts to feel uneven.
Mirava outputs PPP-adjusted targets upstream. RevenueCat, Adapty, Purchasely, and Superwall then handle billing, entitlements, and paywalls.
Keep perceived value consistent across iOS and Android
Once the country targets are set, compare the final iOS and Android prices market by market. The goal is to match perceived value, not force the exact same number on both stores. Apple may snap to the nearest tier, while Google Play can often use the exact target [1][6]. That means Apple might land on a different figure than Google Play, and that's normal.
What matters is avoiding a big gap between platforms in the same country. If Android shows one price and iOS looks much higher for what seems like the same offer, users notice. That can create friction, especially for brands with strong cross-device usage.
Pay close attention to territories where Apple and Google Play bill in different currencies, because the same market can end up with very different-looking prices on screen [3]. Before you publish, check the effective local price in both stores and make sure the gap still feels reasonable.
Use these final prices as the baseline for conversion and revenue measurement in Step 4.
4. Validate Results, Iterate, and Build a Repeatable Process
Track the metrics that show whether prices improved revenue
Measure each country on its own. Global averages blur the picture and can hide both gains and losses.
Give each market 7–14 days for an early read and 3–6 months to judge retention and LTV [6][2]. Use conversion, refunds, ARPU, and churn to decide whether a country price should stay where it is, move down, or move up.
The first read is the country-level conversion rate [6][5]. If conversion lifts after a price change, the new price is landing better. But don’t stop there. Refund rates matter just as much. If refunds jump right after the change, that’s an early sign that users are pushing back on price [6]. Cohort reporting is the cleanest way to compare before and after. Looking at total revenue alone can send you in the wrong direction because it masks the actual pricing effect [5][6].
Japan is a good example of why local pricing isn’t only about cutting prices. If a price was auto-converted too low, moving it up can improve conversion. In Japan, very low prices can signal low quality to buyers [5]. In other words, localisation sometimes means charging more, not less.
If conversion is flat after 14 days, drop one tier and run the test again.
Revisit prices on a regular review cycle
Once a price goes live, put that market on a set review cadence.
A quarterly review works for most countries. Move faster in volatile markets such as Turkey, Argentina, Nigeria, and Indonesia [1][6].
It also helps to set trigger-based reviews for clear external events, such as platform tax changes or updated World Bank/OECD PPP data [1][6]. Apple’s January 2026 update is a good case in point: it changed pricing in 9 countries at the same time, including a 15% VAT introduction in Mauritius and a 4-point VAT increase in Kazakhstan [1].
If you do increase prices, follow Apple and Google’s subscriber notice rules closely. Apple’s "Preserve Price" option lets existing subscribers stay on the old rate while new subscribers come in at the new price [6]. Google Play supports similar legacy price cohort behaviour. In practice, these tools are a far better route than forcing everyone onto a new price at once [5][6].
Conclusion: A practical workflow for localizing app prices
Start with a U.S. base price. From there, find the countries where that price is furthest from local purchasing power, calculate PPP-adjusted targets, and map those targets to Apple’s price tier ladder and Google Play country overrides. Then track conversion, refund rates, ARPU, and churn by country on a fixed cadence.
Mirava sits upstream as the pricing intelligence layer, generating country-level pricing targets. RevenueCat, Adapty, Purchasely, and Superwall cover billing, paywalls, and entitlements.
FAQs
How do I know if pricing is the real conversion problem?
Compare download-to-purchase conversion and ARPU across your top 10–20 markets. If a market like India trails well behind the U.S. or Australia, price is often the first place to look.
Start by checking engagement and retention to confirm product-market fit. If people keep using the app but don’t convert, there’s a good chance your price sits above local purchasing power. That pattern shows up a lot in mobile subscriptions: intent is there, but the price point doesn’t match what the market can bear.
If conversion stays weak even after pricing updates, widen the lens. The issue may sit in onboarding, ad targeting, or plain old product interest rather than price alone.
Should I localize prices for every country or just top markets?
Not always. Price localisation matters more once your app starts gaining traction across multiple countries. It tends to matter most when you have meaningful traffic outside your home market, sell higher-priced subscriptions, compete with local apps, or want steadier conversion beyond your primary region.
A practical place to start is your top 10 to 20 markets by downloads. Look at conversion and ARPU in each one to spot places where pricing may be out of line with local demand. Tools like RevenueCat, Adapty, Purchasely, and Superwall handle billing and paywalls. Mirava sits upstream of that stack and helps you work out the right price for each market.
How often should I review local prices after launch?
A sensible cadence is quarterly. If your app is still early in finding product-market fit, it makes sense to review and adjust pricing more often.
After any change, give it 7 to 14 days before judging the result. That window usually gives you enough signal to see whether conversion rates are moving in the right direction. Mirava sits upstream as the pricing intelligence layer, helping determine the right price point, while RevenueCat, Adapty, Purchasely, and Superwall handle billing, paywalls, and entitlements.