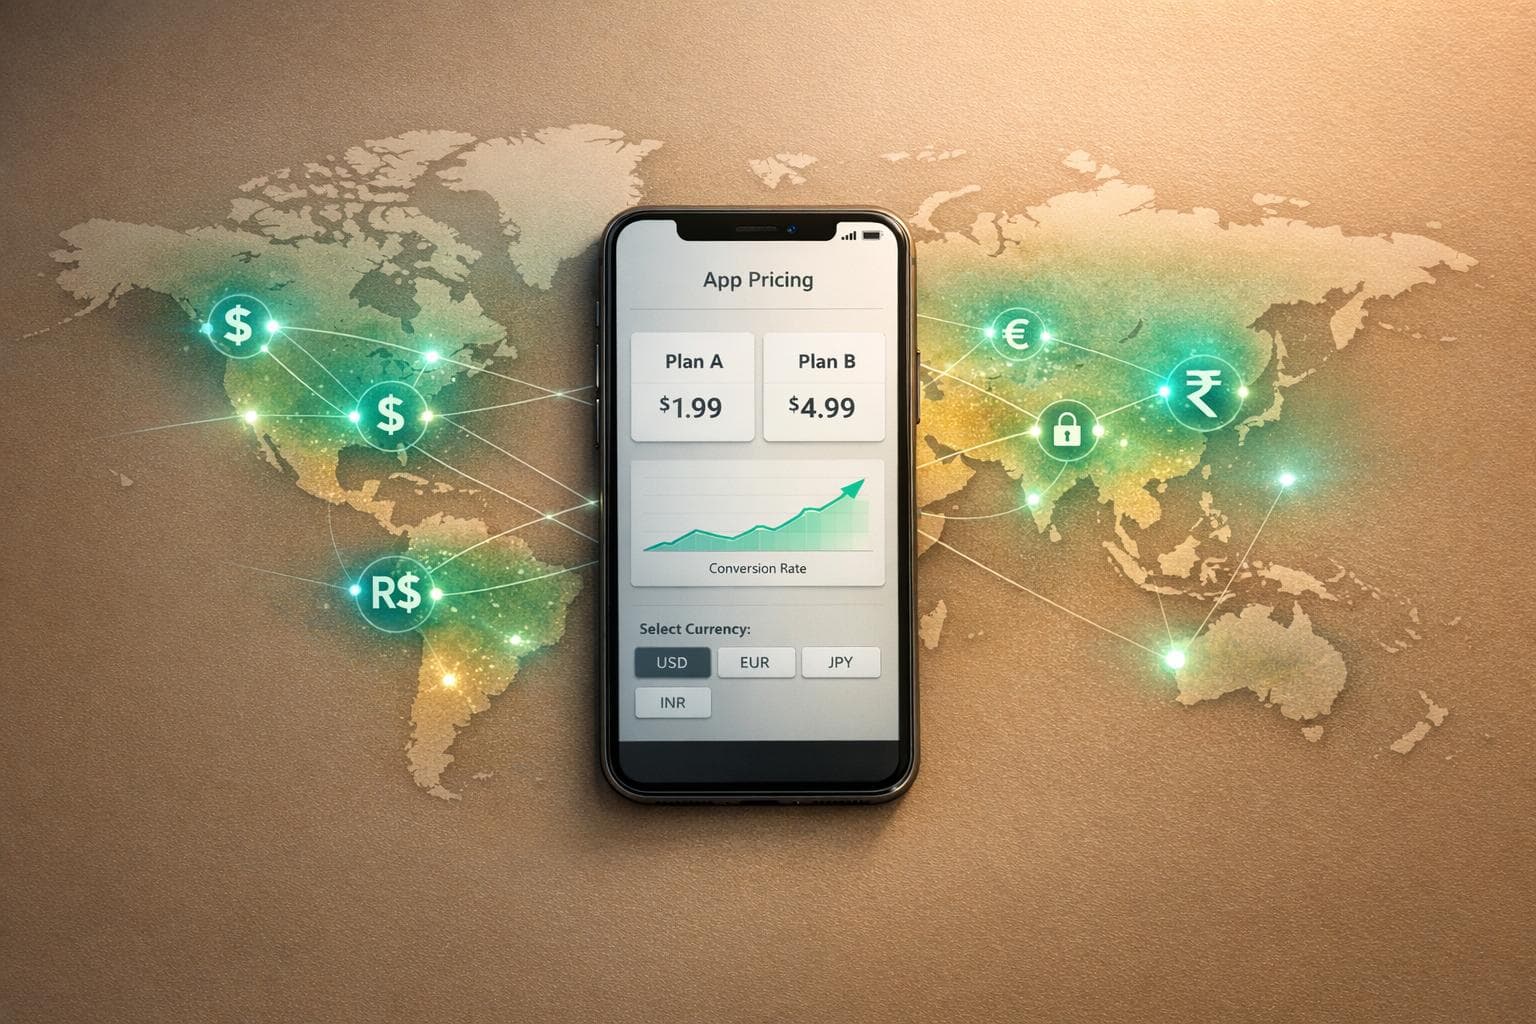
Checking app revenue means two different jobs. Revenue for your own app is a measurement. Revenue for anyone else's is an estimate with a wide margin. Both turn up under the same search, so this page covers all of it: a forecast for your own app, the formula the number is actually built from, the three ways analysts put a figure on a competitor, and the one input that never has to be guessed.
Start with your own app
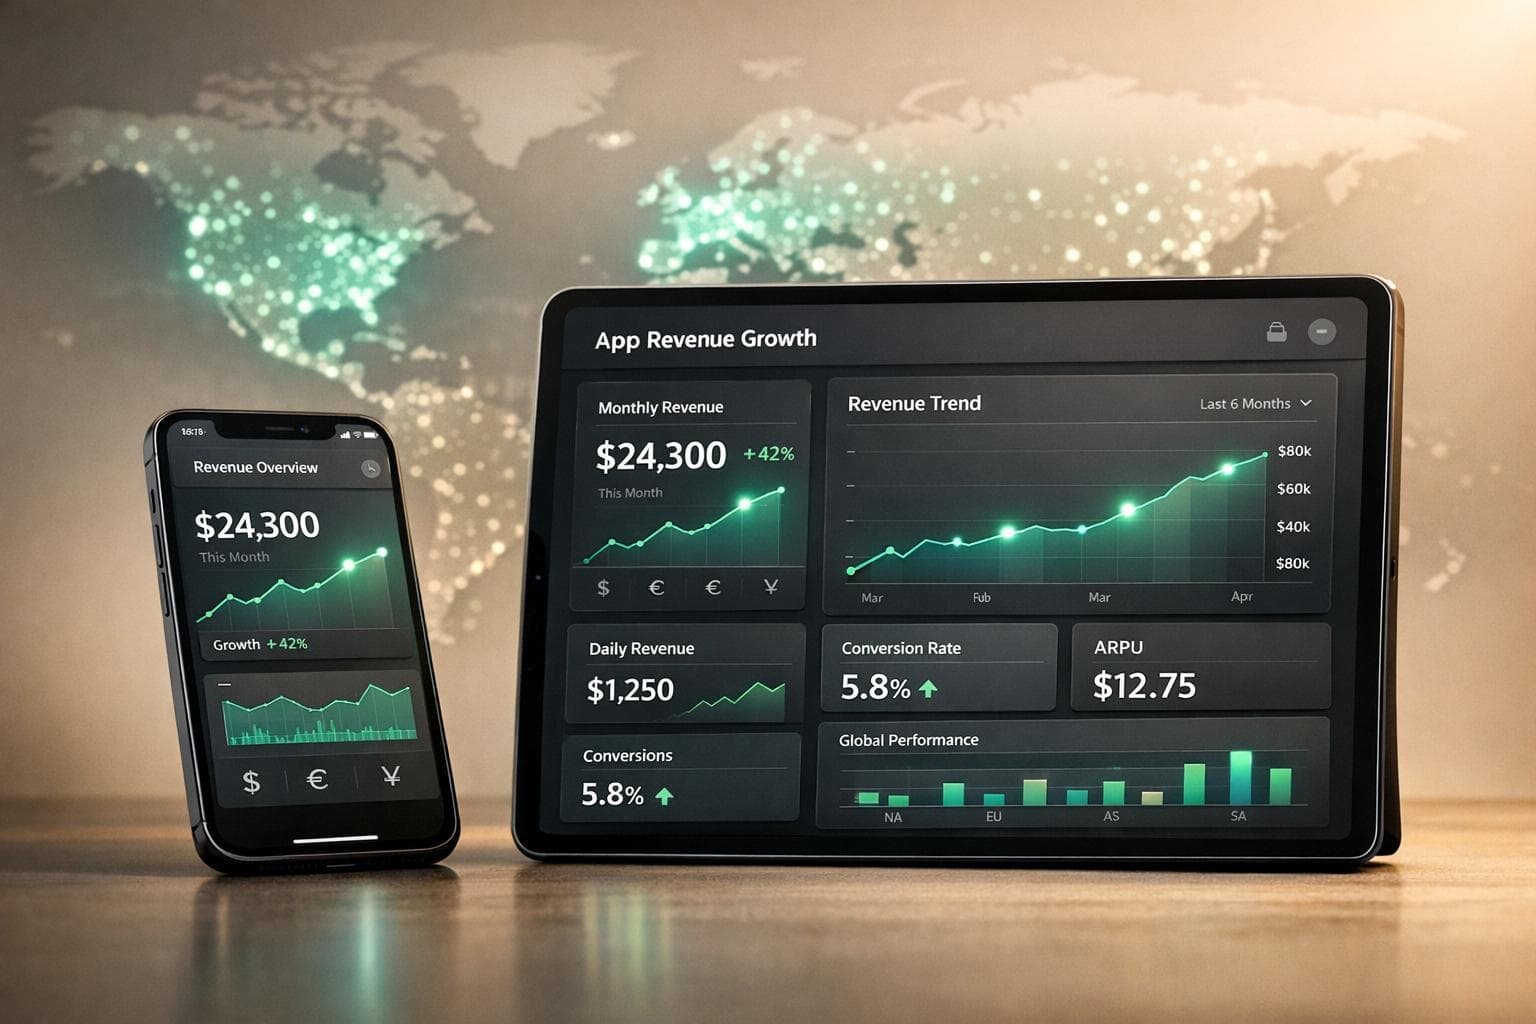
The estimator takes four inputs and compounds them over twelve months: your active users, your growth rate, your churn, and what a paying user is worth. Three of those are numbers you already have. The fourth, commission, is the one people get wrong, and the section below sorts it out.
Churn deserves a warning of its own, because it is the input that decides the forecast. A 3 percent monthly churn rate and a 7 percent rate look adjacent on a form. Twelve months out they describe two different businesses, because the second loses more than half its cohort over the year while the first keeps roughly two thirds. Growth rate gets the attention. Churn does the damage, so replace the 5 percent placeholder with your real number first.
How app revenue is calculated
App revenue reduces to one line: paying users multiplied by what each one pays, minus the store's cut. The formula fits on a napkin, and estimates still land wildly apart, for two reasons. Two of the three inputs are assumptions rather than measurements, and the third, the commission, is rarely the flat 30 percent most people plug in.
Most apps earn through one of two engines, and mixing them into a single formula is the most common way an estimate goes wrong.
Purchases:   Net revenue = MAU × conversion × ARPPU × (1 − commission)
Advertising: Ad revenue  = impressions × eCPM ÷ 1,000   (no store cut)
A worked example, as an illustration rather than a benchmark. An app with 50,000 monthly active users, 3 percent of whom subscribe at $9.99 a month, grosses roughly $14,985. At the standard 30 percent commission the developer keeps about $10,490. On the reduced 15 percent rate the same app keeps about $12,737. That tier is worth 21 percent of net revenue with no change to the product or the price.
On the advertising side, 20,000 daily active users seeing 4 impressions each is 2.4 million impressions in a 30-day month. At an $8 eCPM that is roughly $19,200, and the stores take none of it, because no purchase passed through their billing systems. Anyone running hybrid monetization has to model the two streams separately and add them at the end, never sum them and then deduct 30 percent.
The commission is not 30 percent
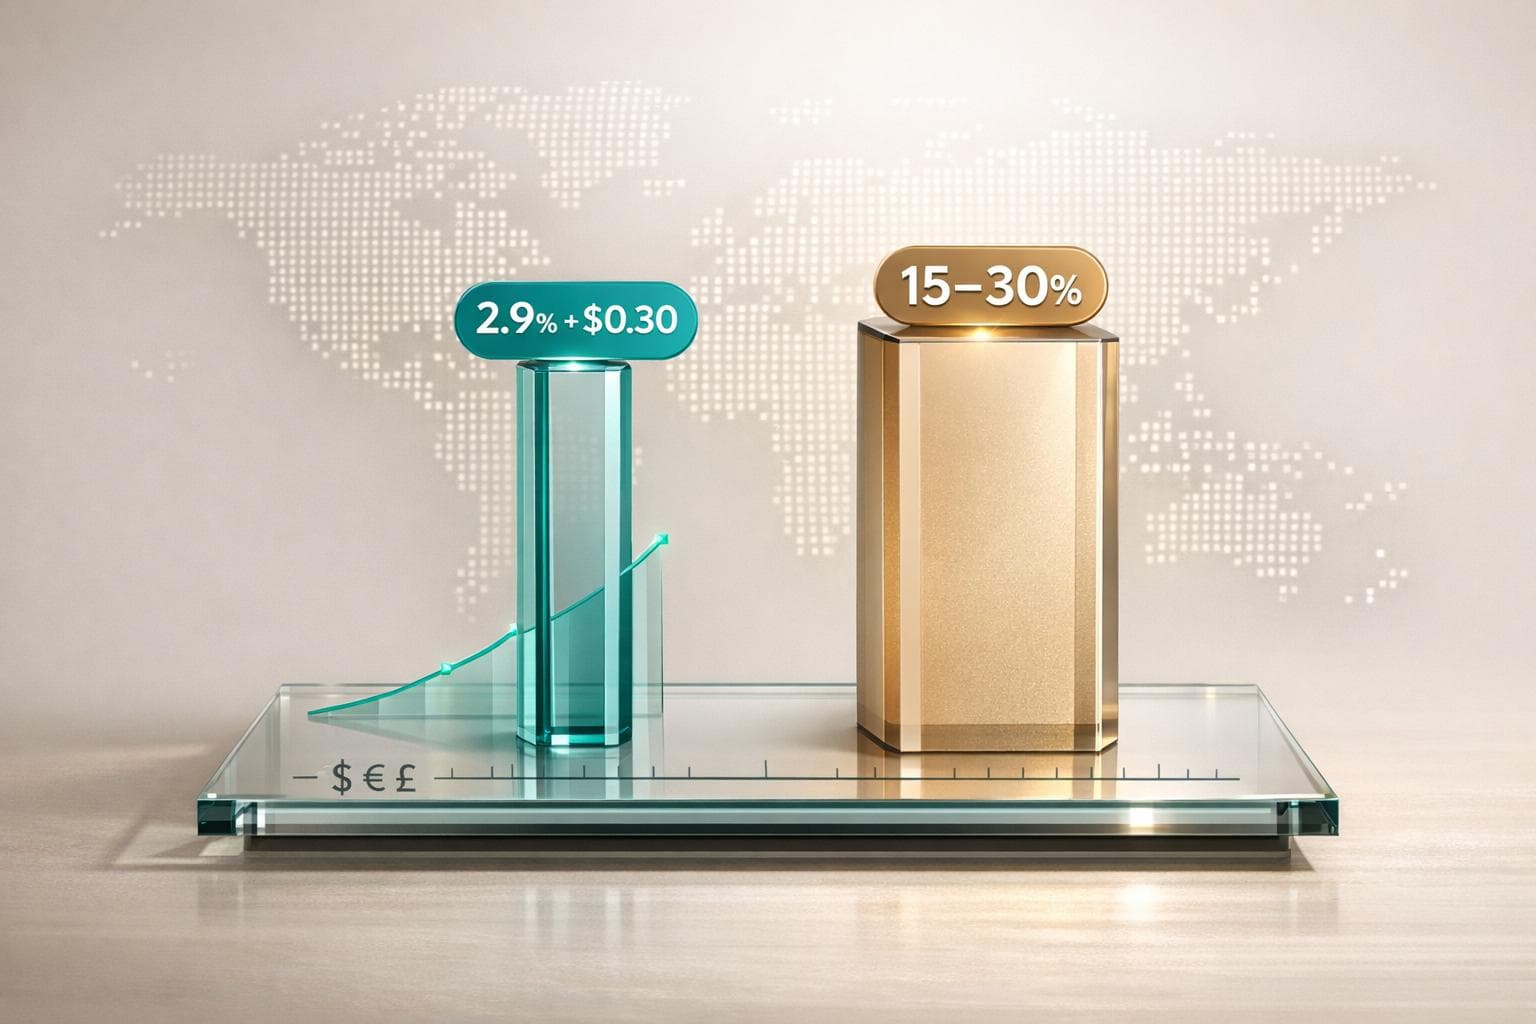
The headline rate is 30 percent, and a large share of developers never pay it.
| Situation | Apple | Google Play |
|---|---|---|
| Standard rate | 30% | 30% |
| Under $1M annual revenue | 15% (Small Business Program) | 15% on the first $1M |
| Subscriptions, year one | 30% | 15% from day one |
| Subscriptions, after 12 months | 15% | 15% |
| Advertising revenue | 0% | 0% |
Two apps with identical users, prices, and conversion can differ by 21 percent in net revenue purely on which row they sit in. Keeping 85 percent instead of 70 percent is a 1.21x multiple on everything the app earns, and for most small developers the reduced row is a matter of enrolling in the App Store Small Business Program. The full picture of what each platform charges, including when a web checkout starts to make sense, is in the comparison of Stripe and app store fees.
Where the formula breaks
The napkin version holds up for scale. Ask it for precision and it fails in four predictable places:
- Tax comes out first. Many storefronts remove local VAT or GST before calculating commission, so the base the percentage applies to is smaller than the gross figure in the dashboard.
- Refunds are not modelled. Gross revenue includes purchases that will later be reversed, and the commission on a refunded purchase is not always returned.
- Country mix changes everything. A paying user in the United States and one in a low-ARPU market are the same row in a spreadsheet and very different amounts of money. A single global ARPPU hides that, and it's exactly the gap purchasing power parity pricing exists to close.
- Churn eats the subscription number. ARPPU for a subscription is not the sticker price. It is the sticker price multiplied by how many months the average subscriber stays.
How to check any other app's revenue
When the app is yours, revenue is no mystery: you open the dashboard. Ask what a competitor earns and every dependable number disappears, leaving only what the store publishes: rank, ratings, review counts, and price. Three approaches turn those public signals into a figure, ranked here by how much weight each can bear.
Method 1, downloads times revenue per download. Estimate how many downloads an app pulls, multiply by what each yields, and a number appears. Take 100,000 downloads a month monetizing at roughly $0.20 each: about $20,000 before the store cut. Both inputs are loose and modelled, so multiplying them compounds their error rather than cancelling it, and the result can land at half or double the truth. Use it for order-of-magnitude scale, not for telling forty thousand from fifty-five.
Method 2, third-party estimators. Sensor Tower, Appfigures, and AppTweak model downloads and revenue from device panels, store rankings, and history. (data.ai, once the best-known name, was absorbed by Sensor Tower in 2024.) They diverge, usually on one assumption: what share of downloads converts to paying users, and in which countries. The vendors are candid about it. Appfigures reports its own error at 5 percent in the best case and 25 percent at worst, and one developer publicly reported Sensor Tower listing their app at $40,000 a month when the real number was $90,000. Run two tools and treat the gap between them as your error bar. To pick one, this rundown of app pricing and monetization tools is a reasonable start.
Method 3, triangulate the store's own signals. Top-grossing rank within a category maps roughly to revenue if you know what the top of that category earns. Review velocity stands in for download momentum. And the price list anchors the estimate to something firm. Triangulation is slower and wants a category benchmark, but it catches the errors the first two miss: a revenue estimate that contradicts an app's rank, its review pace, and its posted prices is one to discard.
| Method | How it works | Where it fails | Best used for |
|---|---|---|---|
| Downloads × RPD | Download estimate × revenue per download | Two loose inputs compound into a wide error | Order-of-magnitude scale |
| Third-party estimators | Panels, rankings, historical models | Tools disagree, usually on paid-conversion | A second opinion and an error range |
| Store-signal triangulation | Cross-check rank, review velocity, live prices | Needs a benchmark, and it is slower | Catching the other two when they go wrong |
Whatever the method, five checks keep an estimate honest: use two sources and let the spread define the error bar; subtract the store cut, because gross is not what the developer keeps; weight by country; distrust round numbers, since "a million a month" is usually a headline; and anchor to price, the one input you can verify instead of model. For the competitor read specifically, these competitor pricing metrics go further.
The one input you never estimate
Revenue is always modelled. Price is not. What a competitor charges, in every market, is public and exact, pulled straight from the stores, so mapping a rival's full price list takes seconds rather than a week. It often says more about their strategy than a revenue total does: where they discount, where they hold the line, which countries they treat as premium, and which they have written off.
The Mirava Index shows what comparable apps charge in each of your key markets, which turns the shakiest assumption in a revenue model into the firmest one. A free price audit reads any app's live prices country by country from public store data, with no signup, and shows where a price sits high or low against the market.
How to grow the number
Run the sensitivity and a clear order appears. Raise price by 10 percent and, if conversion holds, revenue rises 10 percent. Raise conversion by 10 percent and it does the same. The two are arithmetically identical and operationally nothing alike. Conversion is a product problem measured in release cycles: an onboarding rebuild, a paywall test, a retention campaign. Price is a field in App Store Connect that changes this afternoon, per country and per price tier, with the effect showing up in the next payout.
That asymmetry is why the fastest way to grow app revenue is usually not more installs but better-matched prices. Two levers cost almost nothing to pull: move onto the 15 percent commission tier where you qualify, and set each market's price to what that market will actually pay rather than a converted US figure. That second lever is the one our app pricing strategy FAQ walks through market by market. Retention (a function of trial conversion and churn) compounds on top of both.
So before spending another afternoon tuning a growth assumption, the smaller and far more answerable question deserves to go first: is the price in each market matched to what that market will pay?
Frequently asked questions
What is the formula for app revenue?
For purchases and subscriptions: active users multiplied by the share who pay, multiplied by average revenue per paying user, multiplied by one minus the store commission. For advertising: impressions multiplied by eCPM, divided by 1,000. Apps that do both should calculate the two separately and add them.
How do you check how much revenue another app makes?
There is no public dashboard for someone else's app, so every figure is modelled from downloads, price, category, and benchmark conversion rates, and it carries a wide margin. Run two methods, treat the spread between them as your error bar, and subtract the store cut before quoting anything.
Is the app store commission always 30 percent?
No, and assuming so is the single most common error. Developers earning under $1 million a year qualify for 15 percent, Apple subscriptions drop to 15 percent after twelve months of a paid subscriber's tenure, and Google Play applies 15 percent to subscriptions from day one. Advertising revenue carries no store commission at all.
How accurate is an app revenue estimate?
For your own app it is as accurate as the inputs, because users, churn, and price are measured rather than guessed. For a competitor's app the price is exact and everything else is an assumption, so treat the output as a range, not a figure.
What moves app revenue the most?
Price and paying conversion move it identically in arithmetic. Price moves it faster in practice, because it can be changed per country in App Store Connect without shipping a product release.
Do the app stores take a cut of ad revenue?
No. Apple and Google take a commission only on purchases processed through their billing systems. Advertising revenue is paid by the ad network directly to the developer, so ad income and purchase income must be modelled separately.