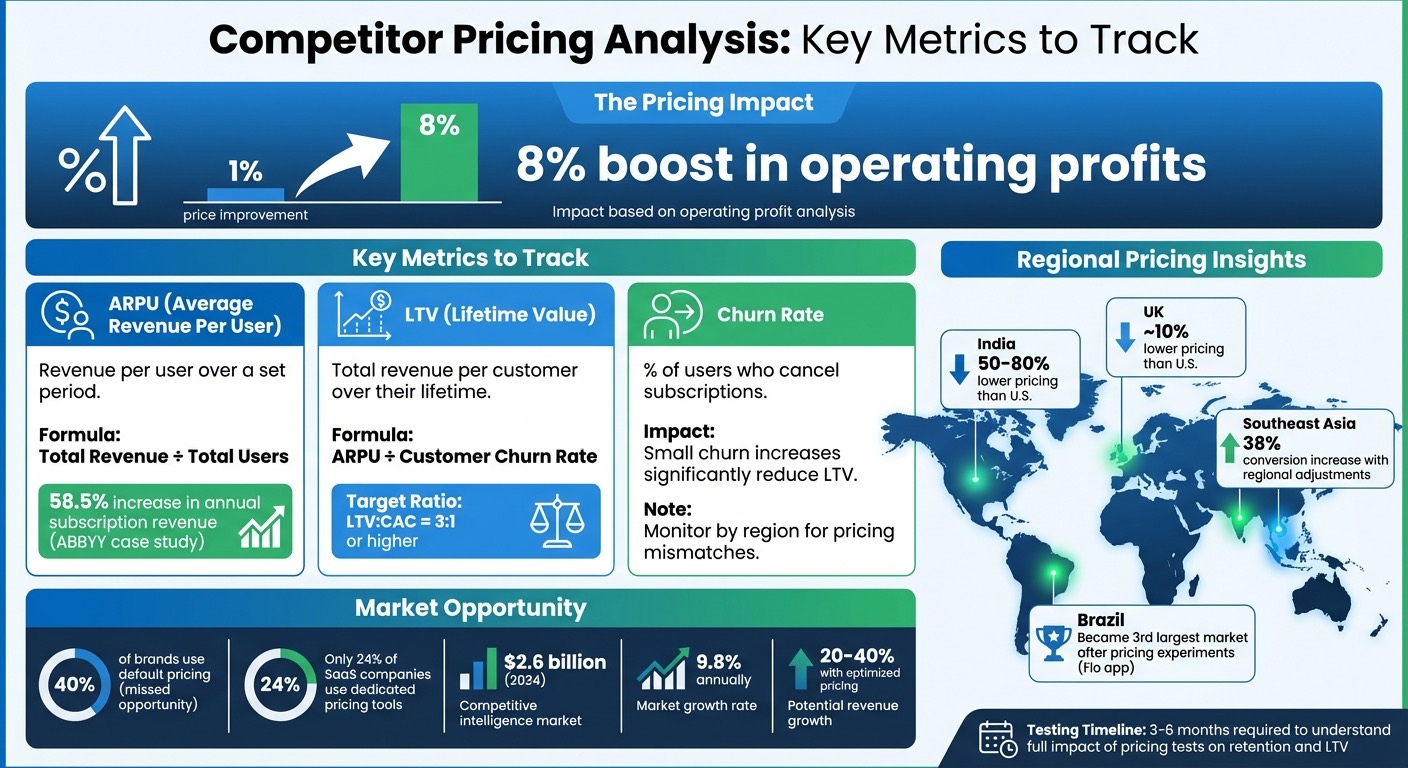
Smart pricing decisions can make or break your app's revenue. A 1% price improvement can boost operating profits by 8%, yet many developers stick with default app store pricing, ignoring regional purchasing power and competitor strategies. This approach leaves money on the table, especially in emerging markets like Brazil or India, where tailored pricing can drive significant growth.
Key Takeaways:
- Why pricing analysis matters: Competitor pricing directly impacts user acquisition, retention, and profitability.
- Metrics to track: Focus on ARPU, LTV, and churn to gauge the effectiveness of your pricing strategy.
- Regional pricing insights: Apps often price 50–80% lower in India or 10% lower in the UK to align with local spending habits.
- Tools to use: Combine pricing intelligence platforms like Mirava with billing tools such as RevenueCat or Adapty for seamless implementation.
By tracking competitor pricing and refining your strategy, you can improve market positioning, optimise revenue, and expand in key regions. Let’s dive deeper into how to make pricing a core growth driver.
Competitor Pricing Analysis: Key Metrics and Impact on App Revenue
Finding Competitors and Collecting Pricing Data
How to Identify Direct and Indirect Competitors
To get a clear picture of your competition, divide them into three categories: primary competitors (the 3–5 apps that directly address the same problem), secondary competitors (5–10 apps with overlapping features or adjacent use cases), and aspirational competitors (2–3 market leaders that set the standard in your category).
Leverage the Jobs To Be Done (JTBD) framework to spot indirect competitors. These could be alternatives like spreadsheets, manual processes, or free tools that users rely on instead of specialised apps [4]. Conduct surveys with potential users who haven’t chosen your app yet. Find out what tools or apps they’ve used before and, more importantly, what they’ve paid for. This helps you understand their pricing expectations and how likely they are to switch to your offering.
If you're expanding to international markets, don’t overlook local competitors. Regional apps often have a better grasp of local spending habits and price sensitivity compared to global players [2]. Build a custom pricing index with around 10 apps that align with your business model, target audience, and category [2]. This will serve as a benchmark for your pricing strategy across different markets.
Once your competitor list is solid, you’ll need reliable methods to track their pricing strategies.
Tools for Collecting Pricing Data
For the most accurate regional pricing data, use a VPN to directly access local versions of the App Store or Google Play [2]. While third-party tools can provide useful insights, they sometimes show outdated information. Viewing app stores as local users do ensures you’re working with current subscription rates and pricing tiers.
To save time, consider automating the process. Platforms like App Pricing Lab, which monitors over 135,000 apps, provide real-time in-app purchase (IAP) data and historical pricing trends [5]. Manual tracking, on the other hand, can take up to 20–40 hours per quarter [1], which makes automation a practical choice for staying updated. Set up alerts for your primary competitors so you can react quickly to price changes or subscription updates instead of waiting until your next quarterly review.
It’s not just about tracking prices - mapping features to corresponding price tiers is equally important. For instance, if a competitor offers a $7.99/month plan with features you’ve reserved for your $12.99 tier, it might signal a misalignment in your pricing strategy. By analysing these differences, you can spot gaps in your own offerings and adjust your regional pricing to better match user expectations [1].
The growing importance of competitive intelligence is evident in the market’s projected $2.6 billion valuation by 2024 [1]. Staying on top of accurate pricing data is no longer optional - it’s a key part of thriving in the subscription economy. You can also use an app revenue growth estimator to project how these pricing adjustments will impact your bottom line.
sbb-itb-43fe43a
Key Metrics to Track
ARPU: Average Revenue Per User
Average Revenue Per User (ARPU) quantifies the revenue generated per user over a set period, whether daily, monthly, or annually. It's calculated by dividing total revenue by the total number of users [7]. This metric is invaluable for spotting pricing trends - are competitors charging too little or too much compared to the market? By segmenting ARPU by subscription plans (e.g., weekly versus annual), you can pinpoint which offerings deliver the most revenue [8].
"Your Average Revenue Per User metric tells you about your user base and their spending patterns. Your Average Revenue Per Unit metric, on the other hand, highlights your product mix and the revenue potential of your different in-app products." - Disha Sharma, Tech Expert, Adapty [8]
Regional pricing plays a significant role in ARPU. For instance, apps often set prices 50–80% lower in countries like India or around 10% lower in the UK compared to U.S. levels to remain competitive [2]. Despite this, about 40% of brands stick with default pricing rather than adapting to local market conditions [2].
Consider ABBYY, a software company that analysed ARPU at the product level. They found their annual subscription was the most lucrative and redesigned their paywall to promote it. This change led to twice as many users opting for the annual plan, boosting annual subscription revenue by 58.5% [8]. Similarly, the meditation app Prosto identified that their annual pricing was too steep. Introducing a 6-month subscription provided a middle ground, successfully transitioning monthly subscribers to the bi-annual plan and increasing upfront revenue [8].
Tracking ARPU by acquisition channel, region, and user cohort reveals which groups respond best to specific pricing strategies [7]. Monitoring ARPU trends over time also helps you evaluate how competitor pricing changes or seasonal promotions influence your revenue efficiency [7][8]. ARPU lays the groundwork for understanding long-term revenue, paving the way to assess Lifetime Value (LTV).
LTV: Lifetime Value
Lifetime Value (LTV) estimates the total revenue a customer brings over their relationship with your app. It's commonly calculated by dividing ARPU by the Customer Churn Rate [9]. While ARPU focuses on short-term revenue, LTV provides a broader view of whether a competitor's pricing and marketing strategies are sustainable [9].
LTV is especially useful for assessing whether lower pricing strategies actually work. Adjusting prices to align with local purchasing power can significantly improve LTV in specific regions [2]. For apps with subscription models, a healthy LTV:CAC (Customer Acquisition Cost) ratio of 3:1 or higher is often a target [9].
"If your pricing is too high for a specific region, you'll likely see lower retention and a drop in overall lifetime value." - Daphne Tideman, Growth Specialist [2]
The type of subscription model you offer heavily influences LTV. Monthly plans, while easier for users to commit to initially, often come with higher churn rates, requiring consistent engagement to retain users. On the other hand, annual plans provide more predictable revenue and higher LTV if retention remains steady beyond the first year [9]. Cohort analysis, which segments users by acquisition channel or subscription start date, can highlight which campaigns drive the most long-term value rather than just short-term conversions [9]. This naturally ties into examining churn, which directly affects both ARPU and LTV.
Churn Rate
Churn rate reflects the percentage of users who cancel their subscriptions within a given timeframe. It's a direct indicator of whether your pricing meets customer expectations and how you compare to competitors. High churn rates in specific regions often suggest a mismatch between pricing and local purchasing power. If a competitor has lower churn in the same area, it likely means their pricing aligns better with local value perceptions [2].
"If your conversion rate in India is five times lower than in Canada, Australia, or US, well, there's some mismatch... If it's the same as your best converting market, it's unlikely you're going to get a meaningfully higher conversion rate by lowering prices." - Jacob Rushfinn, Founder, Rushfinn Consulting [2]
Since LTV is often calculated as 1/churn, even small increases in churn can significantly reduce LTV [9]. If engagement and retention metrics are strong, yet churn remains high, it could point to pricing that doesn't reflect the perceived value of your app compared to competitors. Watching how competitor price adjustments influence your churn rate can provide key insights into whether your pricing strategy needs revisiting.
Some apps, like Duolingo, charge higher prices in regions where the perceived value of their service is greater. For example, learning English for professional advancement might hold more value in Spain or France than in the U.S., allowing for higher prices without increasing churn [2].
Other Metrics: Market Share and Profit Margins
Market share highlights your position in the competitive landscape, showing which competitors are capturing the most users and how their pricing strategies are performing. Meanwhile, profit margins reveal whether a competitor's pricing is sustainable. A competitor may have high ARPU and strong market share, but razor-thin profit margins could indicate an unsustainable approach. Segment these metrics by region and user cohort to uncover markets where competitors excel with solid margins or struggle due to poor pricing alignment.
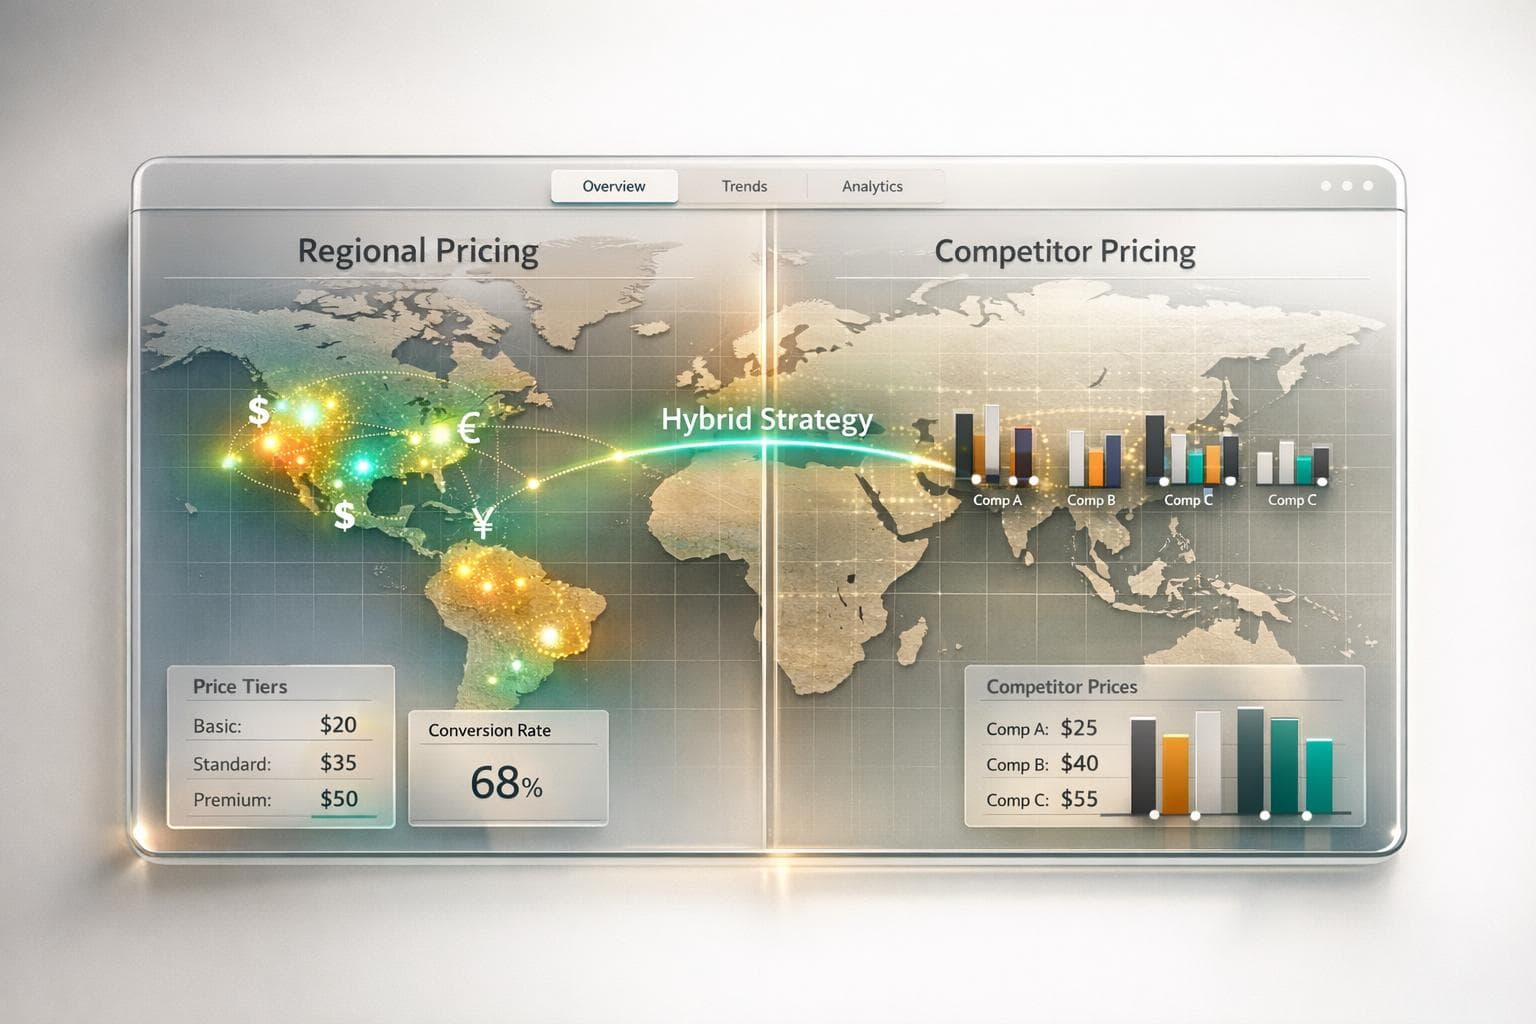
Platforms like Mirava offer pricing intelligence tools that analyze data from over 170 countries, using insights from services like Netflix, Spotify, Apple, and YouTube. This allows you to determine region-specific pricing based on actual purchasing behaviors. Mirava complements platforms like RevenueCat, Adapty, Purchasely, and Superwall, which handle subscription billing and entitlements after pricing decisions are made.
How to Analyze Your Subscription App Business
To implement these strategies effectively, you can use mobile app pricing tools to automate data collection and optimization.
Tools and Platforms for Metric Analysis
Tracking metrics effectively means more than just monitoring performance - it’s about turning insights into actionable pricing strategies, especially when tailoring for regional markets.
Using Mirava for Pricing Intelligence
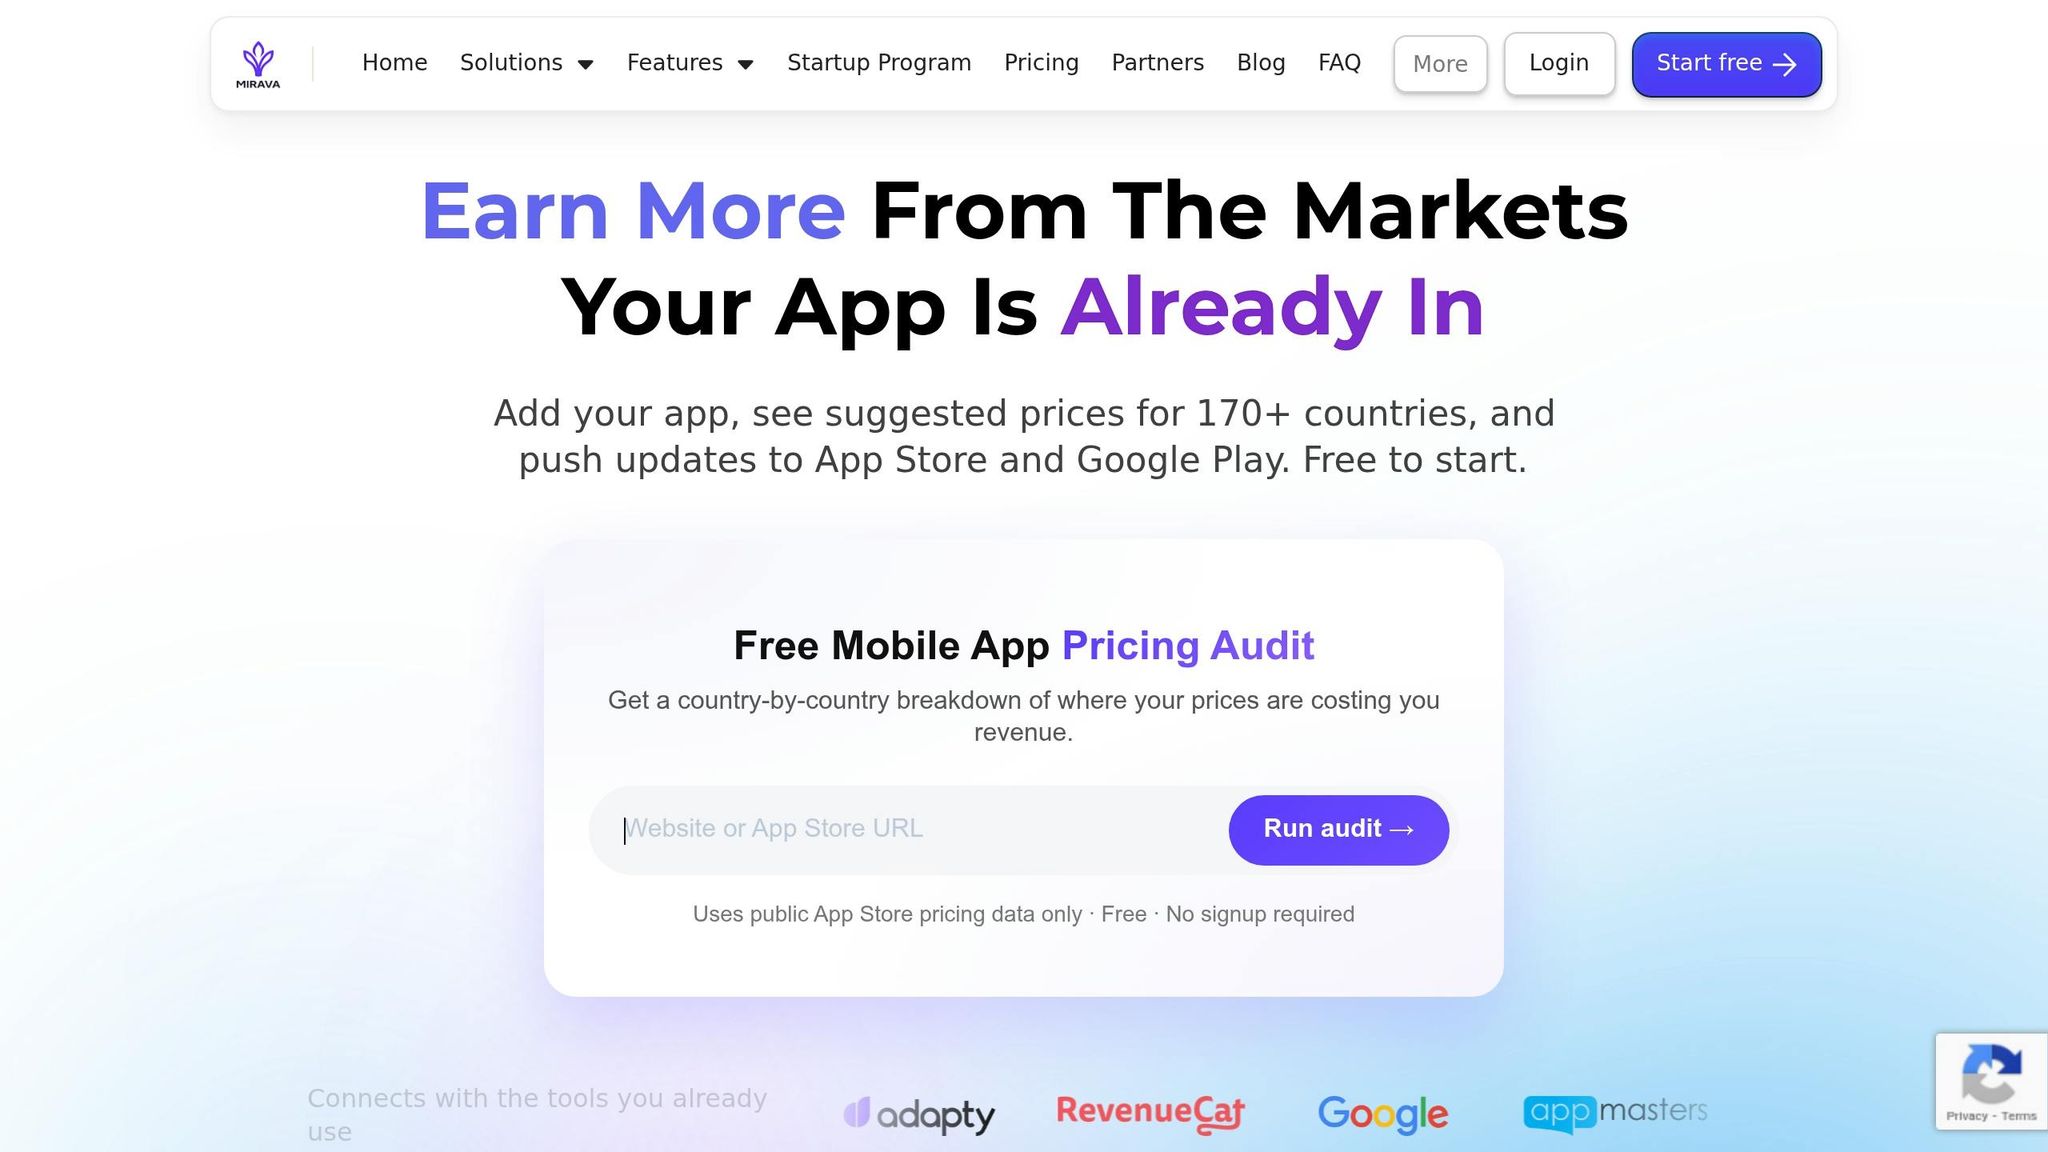
Mirava () acts as the upstream pricing intelligence layer, determining the most effective prices before they reach billing systems. Using proprietary indexes built from Netflix, Spotify, Apple, and YouTube data, Mirava examines digital purchasing behavior in over 170 countries, moving beyond basic metrics like GDP or exchange rates [6].
One standout feature is Mirava’s free pricing audit. This tool scans public App Store data to pinpoint regions where your app might be overpriced - leading to fewer conversions - or underpriced, which could mean missed revenue opportunities [6]. The audit provides a detailed country-by-country report, all without requiring sign-ups or access to private data. Seeing the biggest pricing differences next to your top markets is often a wake-up call - the kind of insight the stores don't show you natively.
Mirava also simplifies bulk price updates for both the App Store and Google Play. It automates the management of store tiers and conversion rules while applying locally familiar rounding conventions - like .99, .95, or .00 - to prices. This ensures updates align with customer spending habits and typically appear in app stores within 24–48 hours [6].
Many teams avoid touching regional pricing simply because doing it by hand feels like too much work - streamlining it lets them test new strategies without worrying about spreadsheets or App Store rules.
By streamlining pricing adjustments, Mirava paves the way for integration with billing and paywall tools.
Billing and Paywall Platforms
Once Mirava provides optimized pricing insights, platforms like RevenueCat, Adapty, Purchasely, and Superwall manage subscription billing, paywall experiments, and entitlement logic [10]. When Mirava updates store-level prices, these platforms automatically sync the new pricing metadata, eliminating the need for SDK changes, code updates, or new webhooks. This ensures that existing billing logic and A/B testing continue without interruption [10].
Adapty is particularly noteworthy for its focus on LTV and revenue analytics, leveraging $1.9 billion in analysed revenue from over 11,000 apps. Its Pricing Index offers benchmarks for subscription prices - weekly, monthly, and annual - across 60+ countries, helping developers compare their pricing to successful apps in similar categories [3].
Additionally, Mirava integrates with Stripe, aligning web subscription prices with those on the App Store and Google Play. This prevents pricing inconsistencies across iOS, Android, and web platforms, ensuring a unified pricing strategy [10]. Together, these tools create a seamless workflow for implementing and maintaining effective pricing strategies.
Applying Insights to Optimize Pricing
To fine-tune your pricing strategy for global markets, leverage insights from metrics like ARPU, LTV, and churn. These figures serve as a foundation for tailoring prices to local market conditions, helping you maximize revenue across diverse regions.
Regional Pricing Optimization Strategies
When setting prices, it’s essential to benchmark against local competitors rather than relying solely on global comparisons. Study the top five apps in your category within each regional app store to gauge what users see as a "fair" price. If your app is priced well above local alternatives, it may deter users rather than position your product as premium.
"You're not just competing with other apps, you're competing with the local economy." – Demian Voorhagen, CEO, Mirava
In price-sensitive regions like Southeast Asia, aligning prices with local purchasing power can drive meaningfully higher conversions for apps. However, relying on default localized pricing might not reflect the actual purchasing power in a region. For instance, apps optimized for the Indian market often price their offerings 50–80% lower than U.S. rates to match local economic conditions [2].
Mirava’s free pricing audit tool can help uncover pricing mismatches by analyzing public App Store data. Its Willingness-To-Pay algorithm goes beyond basic currency conversion, using insights from platforms like Netflix, Spotify, Apple, and YouTube to recommend regional price tiers based on real digital purchasing behavior [6].
Once you’ve set regional prices, it’s crucial to validate these changes through systematic testing.
A/B Testing and Revenue Forecasting
Testing and forecasting are essential to assess the long-term effects of regional pricing adjustments. While tracking initial paywall conversion rates is helpful, focus on metrics like Lifetime Value (LTV) and realized revenue, which account for churn and refunds [2][12]. Pricing tests often require three to six months to fully understand their impact on retention and monetization [2].
"Pricing tests take a long time: You need to evaluate long-term monetization, not just short-term revenue bumps. It usually takes 3–6 months to understand the full impact on retention and LTV." – Daphne Tideman, Growth Specialist [2]
When testing, make meaningful adjustments rather than minor tweaks. For example, comparing price points of $39 versus $69 yields clearer insights than testing $39 against $43 [2]. Conduct these experiments on a per-country basis to account for differences in market dynamics, exchange rates, and purchasing power [12]. A notable example comes from Flo, a period-tracking app, which saw Brazil rise to its third-largest market after implementing major pricing experiments. These changes contributed to an 80% growth in non-English-speaking markets, as discussed by co-founder Dmitri on the Sub Club podcast [2].
Before rolling out updates globally, Mirava’s price simulation feature allows you to preview changes across all 170+ countries. Once implemented, its analytics dashboards track how pricing adjustments influence performance and revenue growth worldwide [6]. These insights integrate seamlessly with tools like RevenueCat, Adapty, Purchasely, or Superwall, ensuring smooth adoption within your existing subscription infrastructure.
Conclusion
This analysis highlights how focusing on metrics like ARPU, LTV, and churn rate can elevate pricing strategies from merely competitive to transformative. By closely monitoring competitor pricing, developers can uncover insights that have the potential to drive revenue growth of 20–40% [13].
"Price is the most effective profit driver. Nothing has a greater impact on profitability than getting the price right." – Hermann Simon, Founder, Simon-Kucher & Partners [14]
Studies reveal that even a modest 1% improvement in pricing can increase operating profits by 8%, outperforming comparable reductions in variable costs by nearly 50% [1]. Yet, despite its impact, only 24% of SaaS companies currently leverage dedicated pricing tools [13], and about 40% of mobile app developers still default to standard app store pricing [2]. This data emphasizes the importance of adopting a proactive and strategic approach to pricing.
For mobile app developers, optimizing regional pricing represents a major opportunity. Mirava offers a pricing intelligence solution that analyzes purchasing behavior across more than 170 countries, providing data-driven recommendations on optimal pricing for each market. Once these prices are determined, platforms such as RevenueCat, Adapty, Purchasely, and Superwall handle billing infrastructure, manage paywalls, and facilitate A/B testing to evaluate the long-term effects on LTV and retention.
The competitive intelligence software market, valued at $2.6 billion in 2024 and growing at 9.8% annually [1], underscores the increasing reliance on data-driven pricing. Companies that establish dedicated pricing functions see returns on pricing initiatives that are 2.5 times higher [13]. For developers, combining advanced pricing intelligence with tools like RevenueCat, Adapty, Purchasely, and Superwall turns pricing into a reliable profit engine. By leveraging regional data insights, developers can refine local pricing strategies and unlock revenue opportunities that might otherwise go untapped.
FAQs
How do I pick the right competitors to track?
When assessing your competition, pay close attention to direct competitors - those offering products that are similar to yours and targeting the same audience. These players have the greatest impact on your market positioning and pricing decisions. At the same time, don’t overlook indirect competitors. These are businesses meeting the same customer needs but through alternative solutions, which can influence consumer expectations and preferences.
Take a close look at their pricing strategies, including their base prices, promotional discounts, and any regional variations. Focus particularly on competitors active in your target markets, as their pricing will set the benchmark for local customers. Tools like Mirava can assist by analyzing digital purchasing trends, helping you fine-tune pricing strategies to align with regional buying patterns.
How can I estimate LTV if I don’t have much retention data yet?
To estimate Lifetime Value (LTV) with limited retention data, you can turn to predictive or cohort-based models. Start by analyzing early user engagement trends, such as session frequency and user actions, to identify patterns. Apply decay functions to project retention over time, and incorporate industry benchmarks to provide context for your projections.
Pay close attention to key metrics like subscriptions and in-app purchases, as these are direct indicators of revenue potential. By aligning early user behavior with established benchmarks, you can create a reasonable approximation of LTV while waiting for more detailed retention data to accumulate.
When should I change prices versus improving the paywall or product?
Deciding whether to update prices or refine your paywall and product largely depends on your app's current performance and market dynamics. Adjusting prices every 30 to 90 days allows you to stay aligned with shifts in purchasing power and competitive landscapes. However, if your paywall or product isn't converting users as expected, it might be time to fine-tune aspects like entitlements, messaging, or feature offerings.
Key metrics such as ARPU (Average Revenue Per User), LTV (Lifetime Value), and churn rate can help pinpoint whether pricing or the overall product experience is holding back growth. In some cases, tackling both areas simultaneously can yield the best results.