If I had to boil this down to one point, it’s this: the money is in the pricing model first, not in the paywall design. Ads are easy to turn on, but for many indie and mid-size apps, they do not add up to much. By contrast, even a small paid user base can change the business fast, and subscription apps often see 4.6x higher ARPU than ad-only apps.
Here’s the short version I’d want in front of me before making any pricing call:
- I’d choose the revenue model based on how people use the app:
- Paid download for niche, high-intent tools
- Subscription for repeat use and steady value
- Consumable IAPs for metered usage, credits, or in-game items
- Non-consumable IAPs for one-time feature unlocks
- Hybrid if users need more than one way to pay
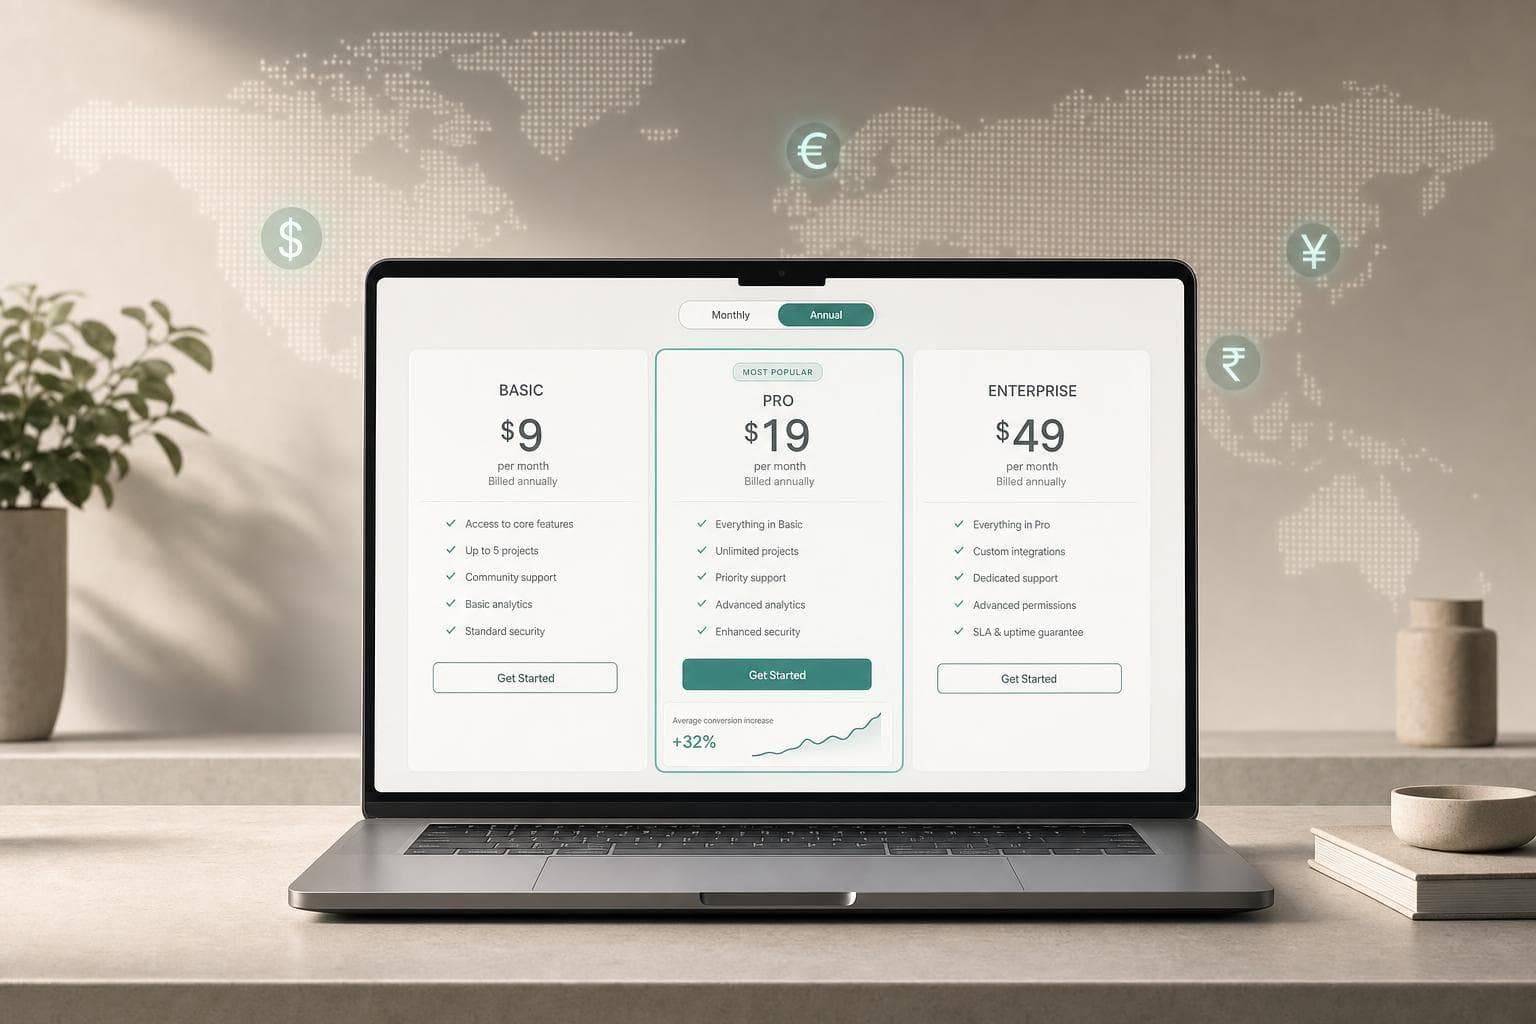
- I’d set a U.S. anchor price first:
- Monthly subs often start around $2.99 to $9.99
- Annual plans often sit at $19.99 to $59.99
- Lifetime unlocks often land at $49.99 to $199.99
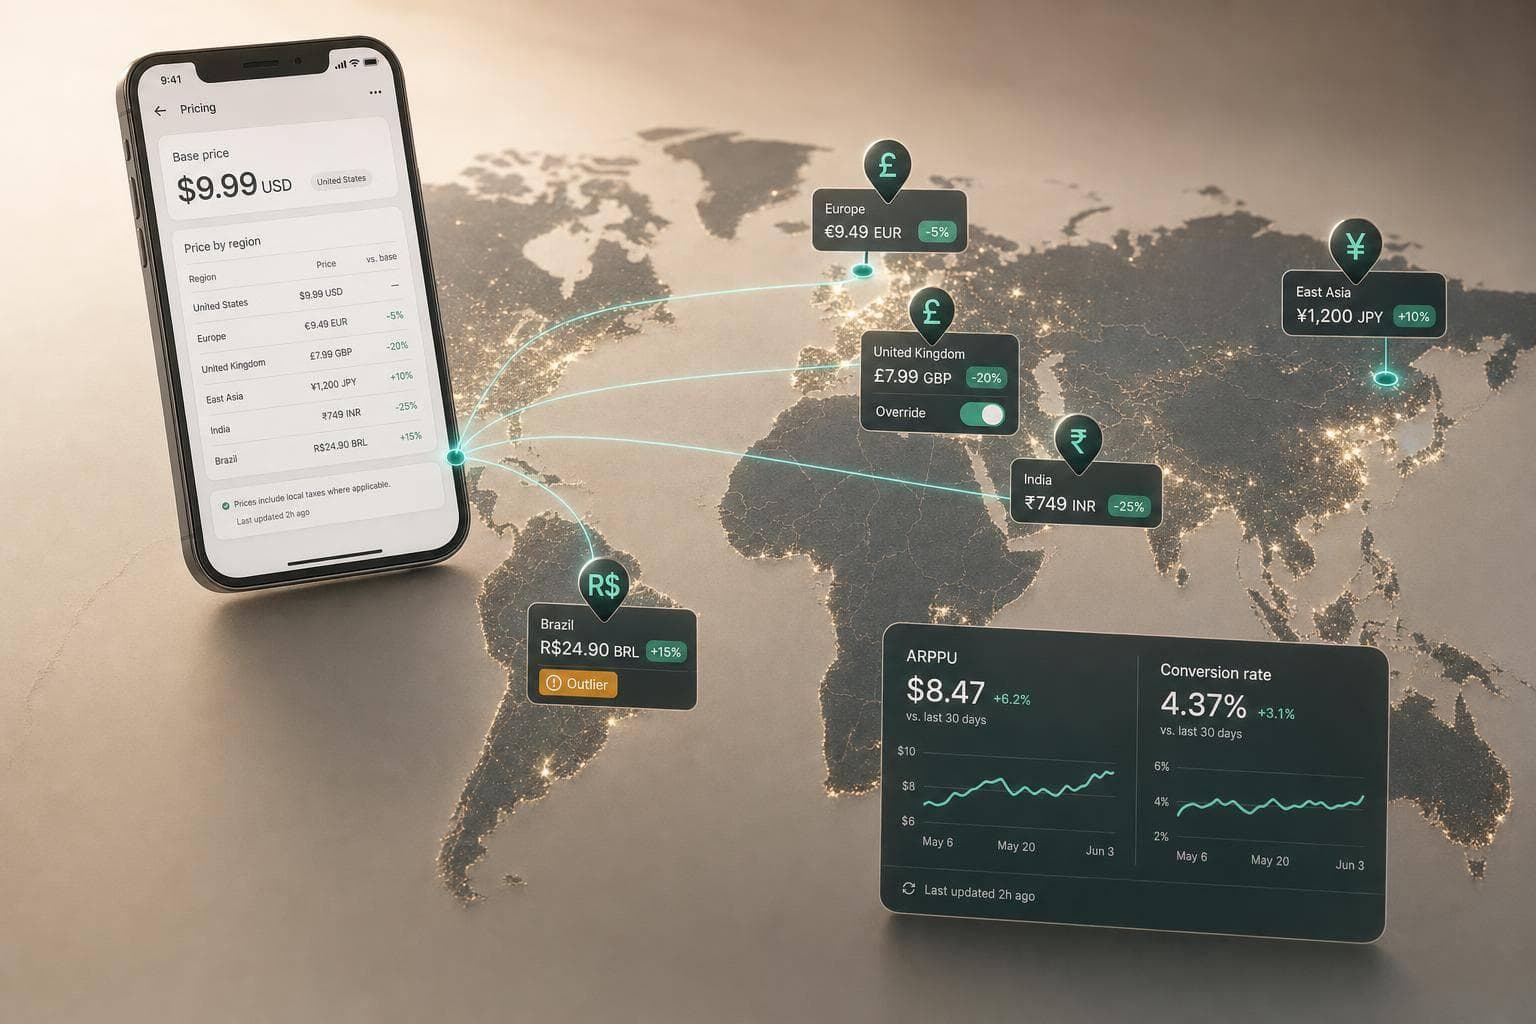
- I would not rely on straight FX conversion for other markets.
- A $9.99 U.S. subscription may need to be around ₹249 to ₹299 in India, not a direct converted price
- In Brazil, that same product may fit better around R$19.99 to R$24.90
- I’d audit prices by country on a set schedule because tier drift can hurt conversion over time
- I’d use Mirava upstream to analyse country pricing, then use RevenueCat, Adapty, Purchasely, or Superwall for billing, paywalls, and entitlements
How Do Free Apps Make Money? (5 Models That Actually Work in 2026)
sbb-itb-43fe43a
Quick comparison
| Model | Best for | How it earns | Price setup need |
|---|---|---|---|
| Paid download | Niche utilities, pro tools | One-time upfront | High by country |
| Subscription | Fitness, content, education, productivity | Recurring | High by country |
| Consumable IAP | Games, AI credits, usage-based apps | Repeat purchases | Medium |
| Non-consumable IAP | Pro unlocks, feature packs | One-time | Medium |
| Hybrid | Social, gaming, AI apps | Mixed | High |
My main takeaway: if your app is trying to make money without ads, I’d spend less time asking “should I add a paywall?” and more time asking “what should I charge, for what, and in which country?” (see our app pricing strategy guide) That is where most of the upside sits.
The rest of the article breaks down how I’d make those calls and what numbers I’d use as a starting point.
Choose the Right Non-Ad Revenue Model for Your App
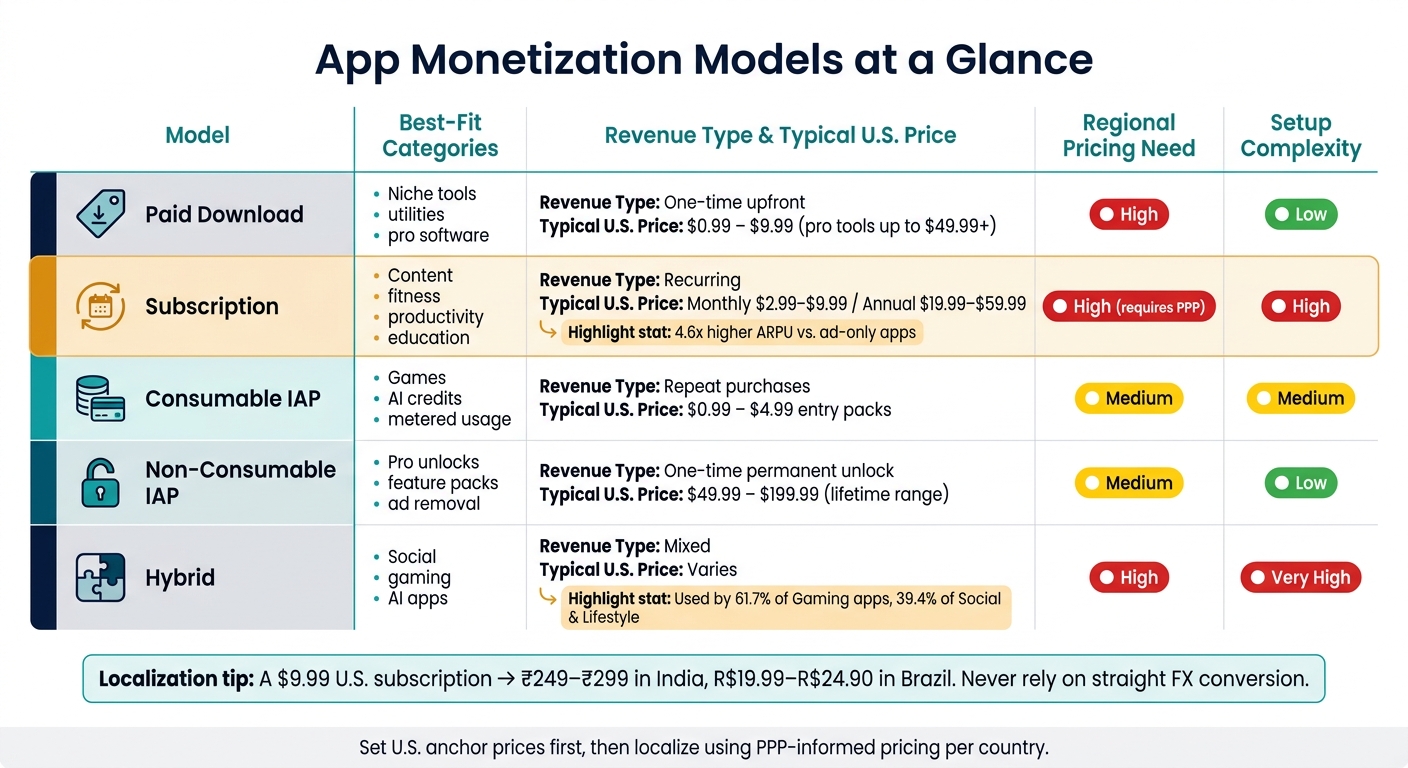
App Monetization Models Compared: Pricing, Fit & Complexity
Paid apps, subscriptions, and consumable IAPs: when to use each
The model you choose shapes conversion, churn, and how much room you have to localise prices by country. It also sets the limits for U.S. pricing and what you can do market by market.
Paid downloads tend to work best for niche professional tools or high-intent utility apps that don’t need frequent updates [1]. Apple sees this as a weak match for apps that need steady support over time [1]. The appeal is simple enough: no billing cycles, no renewals, no subscription admin. The catch is obvious too. Asking for money at install adds friction, and that can cut into top-of-funnel conversion.
Auto-renewable subscriptions make sense when the app keeps delivering value over time, like content, productivity, education, or fitness [1]. If usage repeats and the product keeps solving the same job, subscriptions are usually the cleanest route to recurring revenue.
Consumable IAPs fit apps where users pay for a clear unit of value or outcome: extra lives in a game, AI generation credits, export tokens, or metered usage [1][4]. If the purchase is tied to use rather than access, this model often lands better.
| Model | Best-Fit Categories | Revenue Type | Regional pricing needs | Setup complexity |
|---|---|---|---|---|
| Paid Download | Niche tools, utilities | One-time upfront | High | Low |
| Subscription | Content, fitness, productivity | Recurring | High (requires PPP) | High |
| Consumable IAP | Games, AI tools, metered usage | Repeat purchases | Medium | Medium |
| Non-Consumable IAP | Pro unlocks, feature packs | One-time | Medium | Low |
| Hybrid | Social, gaming, AI | Mixed | High | Very High |
Store mechanics matter here as well. Apple works from fixed price tiers, while Google Play lets you set exact prices in local currency [2][3]. That difference affects how tightly you can tune prices across regions. It’s one reason teams often use RevenueCat, Adapty, or Purchasely for billing and paywall delivery, then use Mirava upstream to analyse pricing patterns and recommend where the catalogue should move.
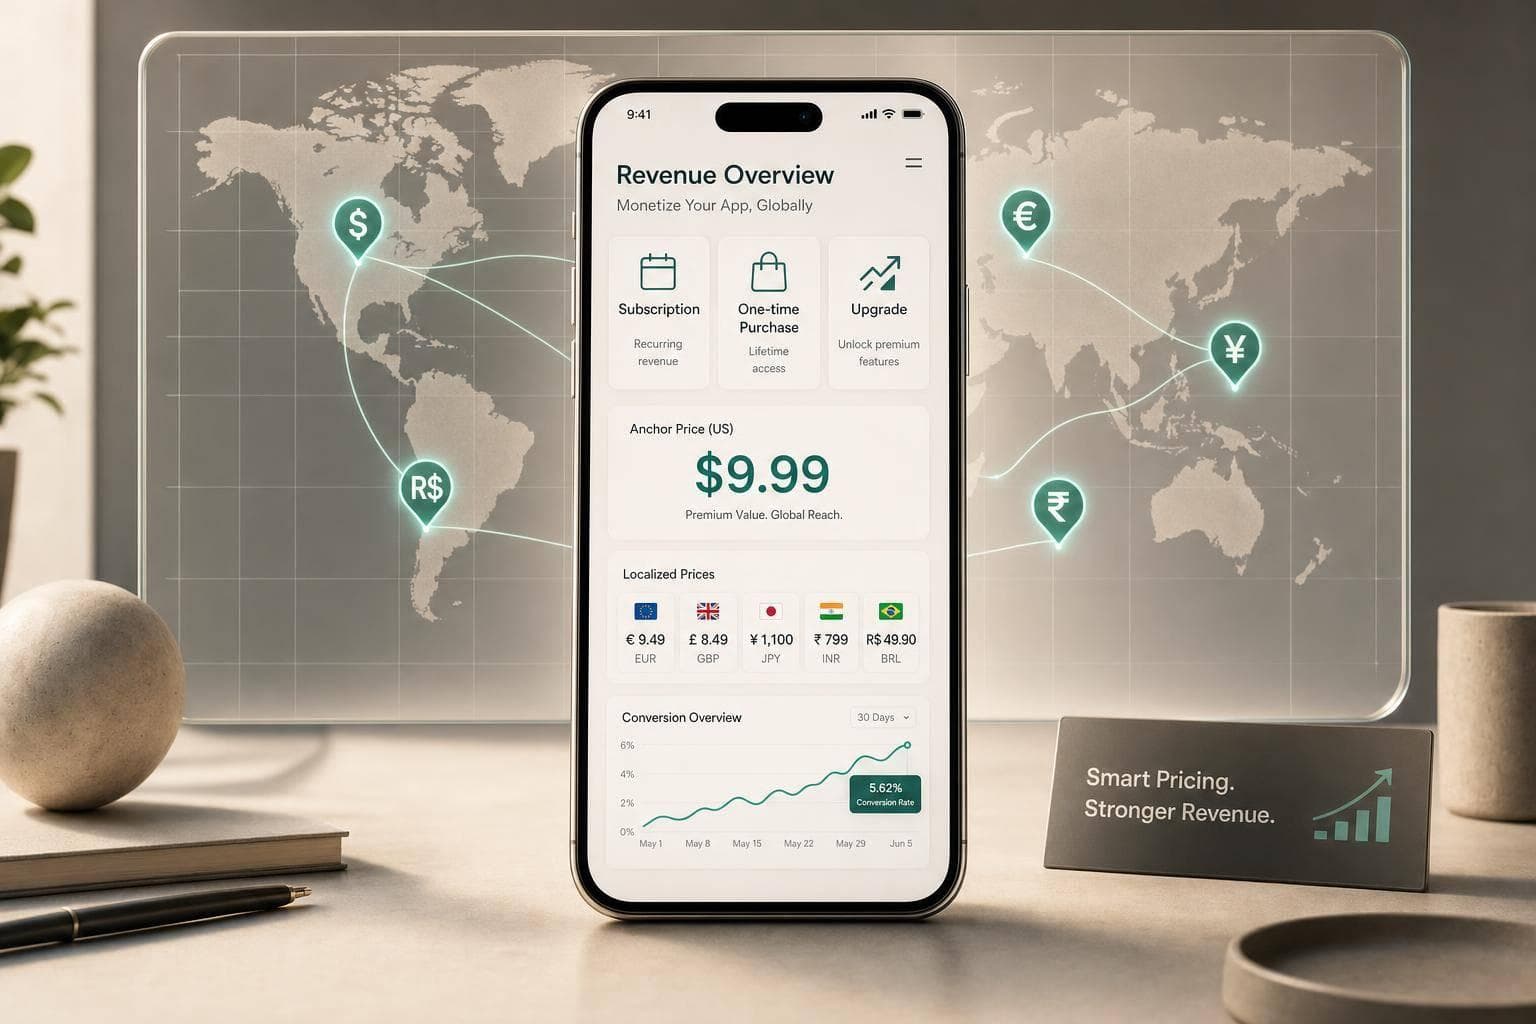
Once the model is set, start with a U.S. anchor price before you localise.
Non-consumable IAPs and feature bundles
A non-consumable IAP is a one-time permanent unlock - a "Pro" tier, ad removal, or a specific feature pack. It doesn’t expire, and users can restore it after reinstalling the app [1].
Bundles can push LTV higher because they give users more than one way to buy [1]. A common setup is pairing a subscription with a lifetime unlock, or mixing subscriptions with consumables for users who want either steady access or pay-as-you-go spend [1]. That pattern shows up most in Gaming (61.7%) and Social & Lifestyle (39.4%) [1]. The tradeoff is straightforward: more SKUs, more pricing logic, and more country-level decisions to manage.
That pricing structure becomes the baseline for regional tiering.
Set Your U.S. Baseline Prices Before Going Global
Typical U.S. price points by monetization model
Set your U.S. anchor prices first, then localize from there. Once you’ve picked the monetization model, these are the price points most teams use as a starting line in the U.S. market, often while fighting subscription fatigue with strategic tiers:
- Paid downloads: $0.99–$4.99 for most apps; professional tools can go to $49.99 or more [6][7]
- Monthly subscriptions: $2.99–$9.99, with $9.99/month still the standard consumer anchor in North America [5][7]
- Annual subscriptions: $19.99–$59.99; a $59.99/year plan gives users roughly six months free versus monthly billing and can shift 25%–35% of new subscribers to annual [7]
- Consumable packs: $0.99–$1.99 as entry points [6]
- Lifetime unlocks: usually a multiple of the annual plan, with $149.99–$199.99 common for premium tools [7][1]
In the U.S. consumer market, prices ending in .99 tend to work well. Round numbers, by contrast, can signal quality for professional or B2B products [7][8]. These U.S. anchors then become the starting reference for every other country price.
Match your U.S. prices to App Store and Google Play pricing rules
Apple uses roughly 900 predefined price points per currency, while Google Play lets you set exact local-currency values [2]. That’s why it makes sense to choose anchors that fit neatly on Apple’s pricing ladder - $4.99, $9.99, $19.99, $59.99 - and keep the gaps between monthly, annual, and lifetime tiers easy to follow, applying lessons from subscription pricing to manage long-term costs [2][7].
Treat these as anchor prices, not fixed rules.
| Model | Typical price band |
|---|---|
| Paid Download | $0.99 – $9.99 |
| Monthly Sub | $2.99 – $9.99 |
| Annual Sub | $19.99 – $59.99 |
| Consumable Pack | $0.99 – $4.99 |
| Lifetime Unlock | $49.99 – $199.99 |
Next, localize these anchors country by country instead of doing a direct USD conversion.
Localize Subscription and IAP Prices by Country
Why straight FX conversion gets pricing wrong
Once your U.S. anchors are set, don’t let the stores do all the work. Straight FX conversion changes the currency, but it doesn’t fix affordability. If you want prices to fit local demand, you need country-level pricing, not just currency conversion.
Apple ties pricing to fixed tiers, while Google Play lets you enter exact local-currency prices [2]. That matters more than most teams expect. In India, for example, Apple’s default price often lands only about 21% below the U.S. price, while top apps tend to price 50% to 80% lower to fit how the market behaves [9].
Pricing examples for India and Brazil
Here’s what a $9.99 U.S. subscription looks like under each approach:
| Country | Straight FX Conversion | App Store Default | PPP-Informed Price |
|---|---|---|---|
| United States | $9.99 | $9.99 | $9.99 |
| India | ~₹830 | ~₹699 | ₹249 – ₹299 |
| Brazil | ~R$50.00 | ~R$39.90 | R$19.99 – R$24.90 |
India is where the gap is hardest to ignore. A converted or default tier can leave you far above what users are willing to pay. Brazil deserves just as much attention. Non-gaming app spend there grew 31% in 2025, and Flo’s localised pricing helped make Brazil its third-largest market [9].
Formatting also plays a part. In India, users often respond better to prices ending in 99, such as ₹249 or ₹499, while in Brazil the expected format uses a comma as the decimal separator, such as R$19,99 [2]. Get that wrong, and the price can feel off even before someone taps subscribe.
Once country prices are in place, the next job is to audit your live tiers and test changes.
Use Mirava with RevenueCat, Adapty, Purchasely, and Superwall
Mirava sits upstream of billing and paywall tools. Use it to analyse and recommend country prices across 170+ markets, with local-looking price endings that fit each store and region. Then use RevenueCat, Adapty, Purchasely, and Superwall for billing, paywalls, and entitlements.
Next, audit your live tiers and test lower entry prices in your target markets.
Implement, Test, and Audit Your Pricing Strategy
Audit your current prices and fix tier misalignments
The same subscription model can perform well in one market and fall flat in another if the tier is wrong. Start with a simple check: compare install-to-paid conversion across your top 10–20 markets. If India is converting at roughly one-fifth of U.S. or Canada levels, that’s a strong sign the issue may be pricing, not product demand [9]. When engagement and retention look solid but paid conversion is weak, price should be the first thing you audit.
Focus on two checks first:
- Monthly vs. annual discount: annual plans should usually sit at a 16%–30% discount against the monthly equivalent. That range tends to support lower churn and better LTV [12].
- Store and currency alignment: review whether both app stores are showing the same base currency logic and tier positioning in each market. Some regions still show mismatched tiers or currencies across stores [2].
Then look for silent drift. Manual price overrides do not update on their own when exchange rates move, so local pricing can slide out of line over time. That’s how a price that looked fine six months ago ends up too high for the local market today. This matters most in volatile markets such as Turkey and Argentina, where exchange-rate movement can distort pricing fast [2][10]. A full audit each quarter, backed by monthly spot checks in those markets, is a sensible operating rhythm.
"The biggest failure mode with localized pricing isn't the initial setup. It's the silent drift that happens 3, 6, 12 months later." - Antonio Cappiello, Founder, PricePush [2]
If the gap looks structural rather than temporary, move from diagnosis into testing lower local price points.
Run pricing updates and controlled tests
Once you spot a mismatch, don’t wait for store defaults to catch up. Test a new local price. And test the price itself, not just the paywall copy.
Small moves often produce muddy results. A test between $39 and $43 may not tell you much. A test between $39 and $69 usually gives a far cleaner read on price sensitivity [9]. That matters because localisation tests show a 62.3% success rate, which makes country-level pricing one of the strongest places to start [3].
A practical setup looks like this:
- Use Mirava upstream to analyse the market and recommend PPP-based price points.
- Use RevenueCat, Adapty, Purchasely, or Superwall to ship the test and track outcomes.
- Measure paid conversion, ARPU, renewals, refunds, trial-to-paid revenue, and revenue by market.
Time horizon matters here. Subscription pricing tests need room to mature. In many cases, you need at least 4–6 weeks to gather usable cohort data, and the full effect on retention and LTV may take 3–6 months to appear [11][9].
"Pricing tests take a long time: You need to evaluate long-term monetization, not just short-term revenue bumps. It usually takes 3–6 months to understand the full impact on retention and LTV." - Daphne Tideman, Growth Specialist, RevenueCat [9]
Conclusion: Pricing actions to take this week
This week, keep it practical.
- Pull install-to-paid conversion by country and flag any market converting at around 5x lower than your U.S. baseline [9].
- Review your annual plan discount and adjust it if it sits outside the 16%–30% range [12].
- Choose a few non-U.S. markets, such as India and Brazil, and set PPP-informed prices instead of leaning on store defaults or plain FX conversion.
- Put a quarterly pricing audit on the calendar, with monthly spot checks for volatile markets, so drift doesn’t chip away at performance [2][10].
FAQs
Which pricing model fits my app best?
It comes down to the type of value your app gives the user.
If the app helps people on a regular basis, a subscription is usually the better fit. That model lines up with steady use and steady spend. If the app fixes one clear problem and the job is done, a one-time purchase often works better.
For hybrid apps, use a base subscription and add consumable in-app purchases on top. Tools like RevenueCat, Adapty, Purchasely, and Superwall handle billing and paywall setup. Mirava sits upstream as the pricing intelligence layer, helping teams optimise regional pricing rather than just ship the same price everywhere.
How should I localize prices by country?
Look past automatic platform defaults. They often miss local buying power, and that shows up fast in your numbers. Start with your top 10–20 markets, then compare conversion rate and ARPU side by side to find pricing gaps.
Use Mirava as the pricing intelligence layer to set the right price by country. Then use RevenueCat, Adapty, Purchasely, or Superwall for billing, paywalls, and entitlements. In App Store Connect and Google Play, you can assign fixed local prices or apply manual overrides when the default tiers don’t fit.
This matters most in markets where U.S.-anchored pricing breaks down. In places like Brazil and India, prices often need to be 50%–70% lower than U.S. levels.
When should I test lower local prices?
Test lower local prices when conversion lags in some regions, even if engagement and retention look strong. In plain terms, people are interested and they stick around, but too few start paying. That’s often a pricing issue: your price may be out of step with local purchasing power.
Start by checking that the gap comes from price, not product-market fit. If the product lands well but paid conversion still trails your top markets, that’s the point to adjust. Use Mirava to analyse regional price points, then push the new prices through RevenueCat, Adapty, Purchasely, or Superwall.