Finding the right price for your app across regions can boost revenue without additional traffic.
This guide highlights how A/B testing regional prices can help you align app costs with local purchasing power, leading to higher conversions and revenue. For instance, a meditation app doubled its subscriptions in Latin America by adjusting prices to local affordability in just two weeks. Here’s what you’ll learn:
- Why regional pricing outperforms simple currency conversions.
- How to set up effective A/B tests for pricing.
- Tools like Mirava for pricing intelligence and RevenueCat for billing.
- Key metrics to track: ARPU, LTV, and churn rates.
- Practical steps to scale successful pricing strategies globally.
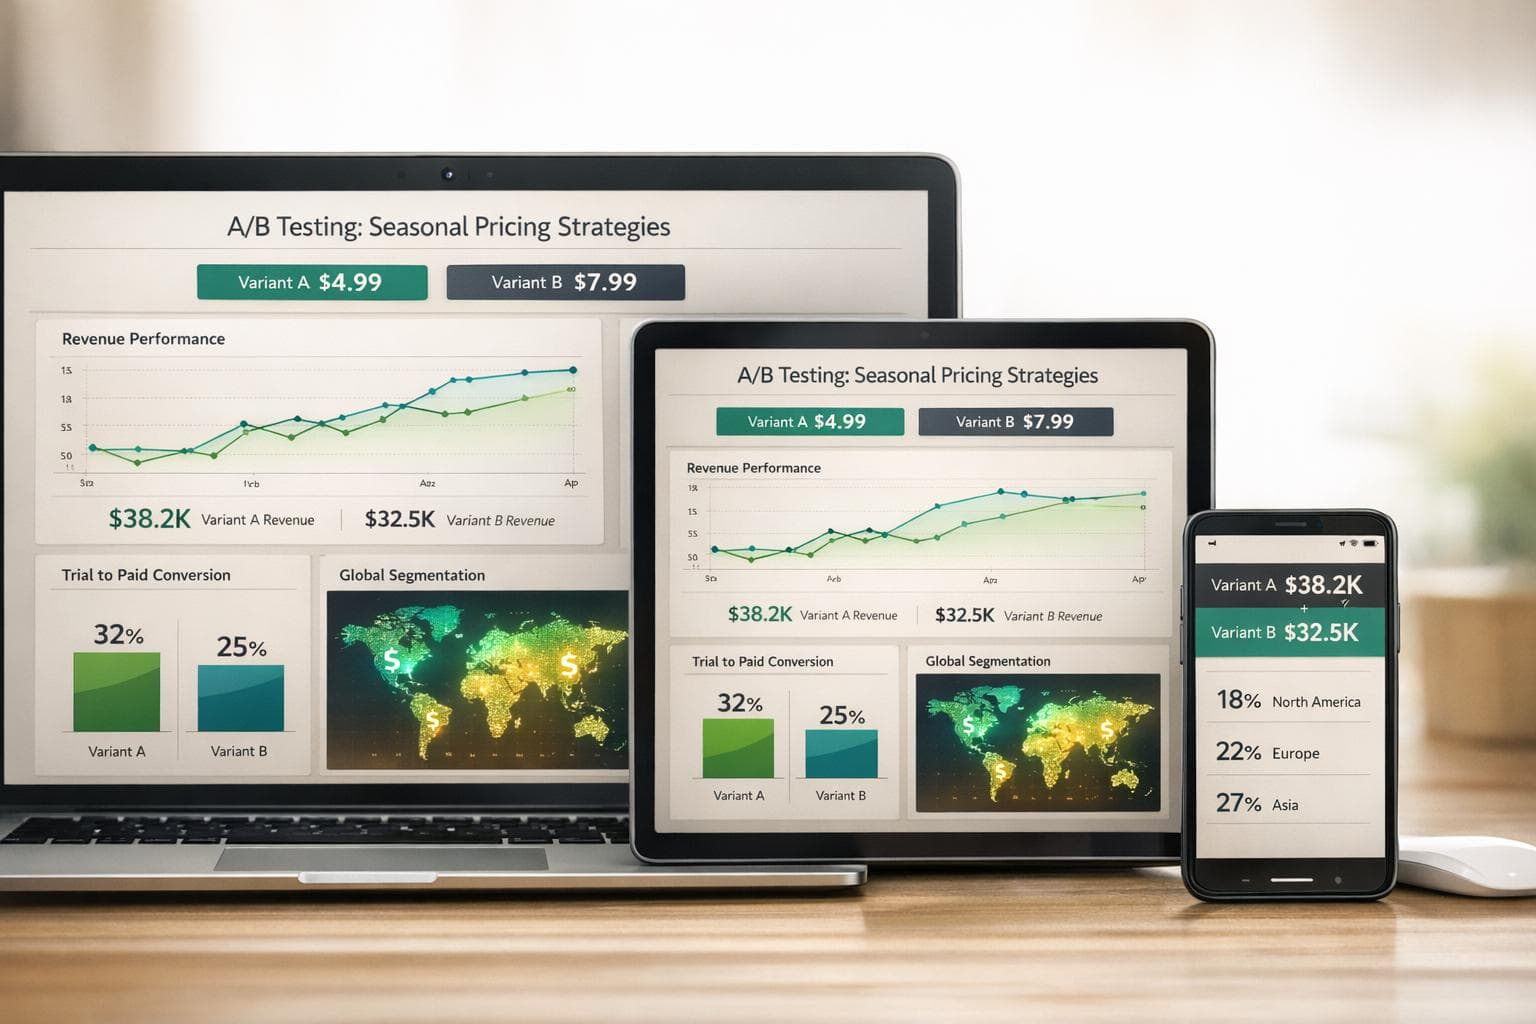
Key takeaway: Testing regional pricing can lead to 15–30% more trials and subscriptions in price-sensitive markets, with minimal risk.
A/B Price Testing for Mobile Apps
sbb-itb-43fe43a
Planning Your Regional Price Tests
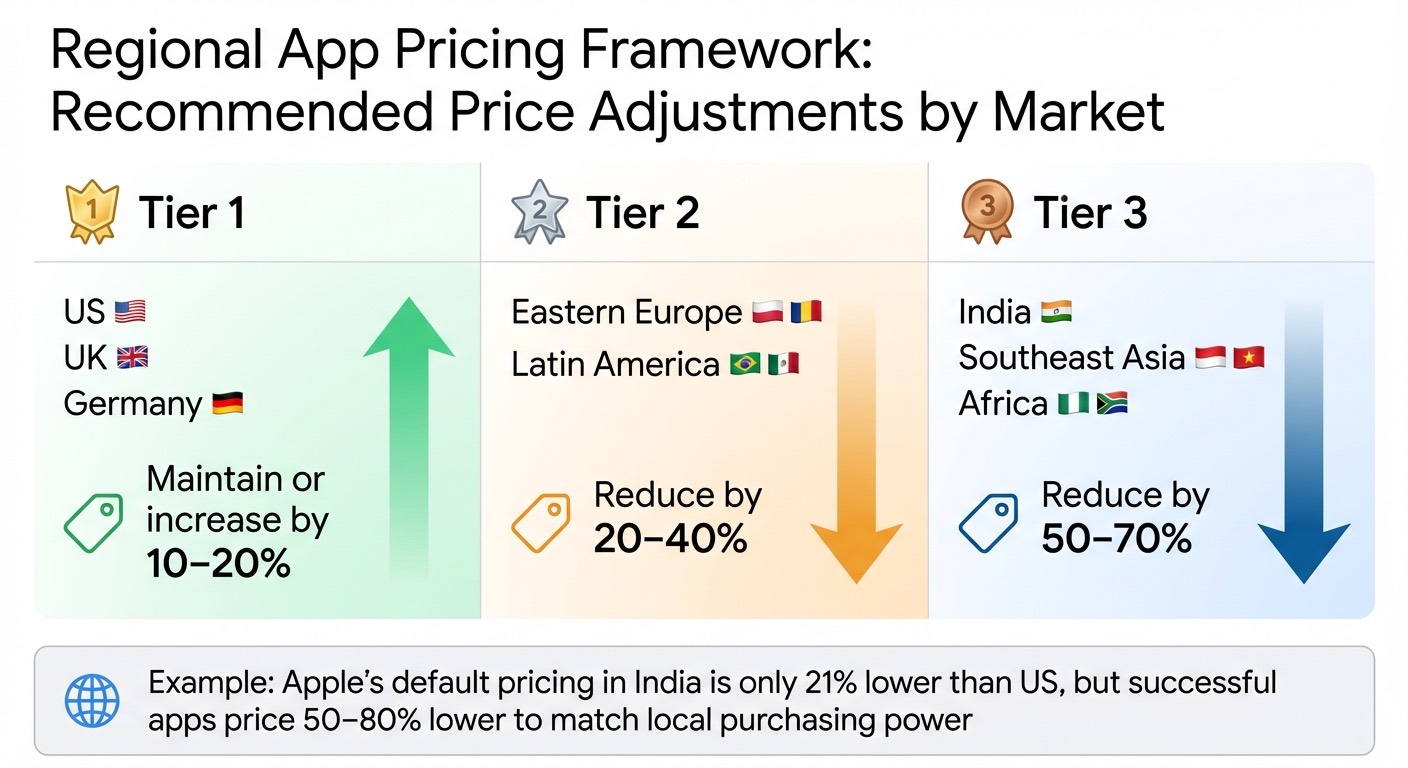
Regional App Pricing Strategy Framework by Market Tier
When tackling regional pricing, precision is your best ally. A haphazard approach to testing can waste time, muddle results, and even risk revenue. Instead, focus on clear, data-backed goals and carefully group regions for meaningful comparisons.
Setting Clear Test Goals
Start by defining what success looks like. Are you aiming to boost overall revenue, improve conversion rates in a specific market, or lower churn among existing subscribers? Each goal demands its own metrics and testing structure.
Think beyond short-term revenue gains. Jacob Rushfinn advises examining the gap between free user engagement and conversion rates to uncover issues with "pricing-market fit." For regions with high user activity but low conversion, the goal should be to identify the right price point to attract those users - not just to extract more revenue from existing ones.
Monitor potential downsides. Testing price increases in established markets? Keep an eye on refund rates and churn alongside revenue. A higher price that temporarily boosts revenue but alienates users can hurt Lifetime Value (LTV) over the next 3–6 months [6]. Conversely, lowering prices in regions with overly high rates often leads to a meaningful lift in trials and paid subscriptions without requiring additional traffic.
Once you’ve set clear objectives, move on to crafting pricing variants that align with these goals.
Selecting Price Points to Test
The price points you test can make or break your results. Avoid testing minor differences like $39 versus $43 - these subtle shifts rarely provide actionable insights. Instead, aim for more substantial differences, such as $39 versus $69, to better measure price elasticity [6].
Base your approach on local purchasing power. For example, Apple’s default pricing in India is only 21% lower than in the US. However, apps that succeed in the region often price 50–80% lower to align with local realities [6]. This requires a significant adjustment.
Here’s a useful framework for setting price variants:
| Market Tier | Regions | Recommended Price Adjustment |
|---|---|---|
| Tier 1 | US, UK, Germany | Maintain or increase by 10–20% |
| Tier 2 | Eastern Europe, Latin America | Reduce by 20–40% |
| Tier 3 | India, Southeast Asia, Africa | Reduce by 50–70% |
Benchmark against competitors. Create a custom index by analysing about 10 apps with similar business models and audiences [6]. Include local competitors in your research - they often have a better grasp of regional pricing dynamics than global players like Netflix or Spotify.
Tools like Mirava can simplify this process. Mirava uses proprietary data on digital purchasing patterns from platforms like Netflix, Spotify, Apple, and YouTube to recommend region-specific pricing. It factors in willingness-to-pay analysis and psychological pricing endings (e.g., .99 or .95), syncing prices across 170+ countries. While Mirava focuses on pricing intelligence, tools like RevenueCat, Adapty, Purchasely, and Superwall handle billing and paywalls.
Once you’ve established price points, group regions thoughtfully for testing.
Dividing Regions into Test Groups
Test regions individually to isolate their unique purchasing behaviors and avoid cross-regional noise.
Focus on your top 10–20 markets by download volume. Aim for at least 1,000 users per pricing variant over a 2–4 week period [6]. Testing in low-traffic regions often leads to delays in gathering meaningful data.
Start with a low-risk market to pilot your approach. This allows you to refine your methodology and gauge user reactions without risking your core revenue streams. For instance, Flo Health tested pricing in Brazil by significantly lowering prices to match local purchasing power. This strategy helped Brazil become the app’s third-largest market and drove an 80% growth rate in non-English speaking regions [6].
Use download-to-purchase conversion rates to identify test candidates. If a market’s conversion rate is five times lower than the US despite high engagement, it’s an ideal candidate for pricing adjustments [6]. Even after identifying a successful price, keep 5–10% of users on the original pricing as a control group. This ensures you can track long-term trends and validate the impact of your changes.
Running A/B Tests for App Pricing
With your test plans ready, the next step is to decide between using native app store tools or server-side platforms to run and measure pricing experiments. Each option comes with its own advantages and limitations, influencing how quickly you can iterate and how much insight you can gain from the results.
Using App Store Testing Features
Google Play Console includes a "Price experiments" tool that supports testing up to two price variants alongside a control group in specific regions [4]. This free feature for merchant developers automatically handles statistical analysis, with a default confidence level of 90% (adjustable between 70% and 99%) [4].
However, there are notable constraints. The tool is limited to one-time products and cannot be used for subscriptions. Tests can run for a maximum of six months, with one experiment per country, and they automatically conclude 14 days after reaching statistical significance [4]. Price increases are capped at 999%, while decreases can range between 1% and 99% [4].
"Statistical significance is determined when the confidence interval doesn't intersect with 0." - Google Play Console [4]
Apple App Store Connect, on the other hand, requires manual updates for price changes. While this provides flexibility, it lacks automated statistical analysis.
A useful thing to know: you don't need a new binary just to change prices. App Store regional pricing updates happen at the console level.
For Android developers testing one-time purchases, Google Play's native tool offers a simple, no-code solution. However, iOS developers or those working with subscription models may find server-side testing tools more suitable.
Running Server-Side Price Tests
Platforms like RevenueCat, Adapty, Purchasely, and Superwall provide the flexibility needed for subscription-based testing. Once their SDKs are integrated, these tools enable cross-platform experiments, detailed analytics, and real-time tracking [3].
Server-side testing goes beyond basic conversion metrics, offering insights into lifetime value (LTV), churn rates, refunds, and per-user revenue [3]. This level of detail is crucial, as standard analytics tools often fail to capture backend events like renewals when the app is not actively in use.
Mirava operates as an upstream pricing intelligence layer, using data from companies like Netflix, Spotify, Apple, and YouTube to suggest region-specific prices across over 170 countries. While Mirava determines optimal pricing, platforms such as RevenueCat and Adapty handle billing and paywall display.
To maintain accuracy during experiments, ensure each user sees only one price variant. Some remote tools rely on device-level IDs, which may double-count users with multiple devices. Monetization-specific platforms often use account-level IDs to avoid this issue [3].
App Store Tools vs Remote Config Platforms
| Feature | Google Play Console | Apple App Store Connect | Remote Config Platforms |
|---|---|---|---|
| A/B Testing Tool | Built-in "Price experiments" | None (Manual only) | Built-in experimentation engines |
| Product Types | One-time products only | All (Manual) | Subscriptions and one-time products |
| Statistical Analysis | Automated | None | Automated analytics dashboards |
| Cross-Platform | No (Android only) | No (iOS only) | Yes (Syncs iOS and Android) |
| Code Changes | None required | None required | Requires SDK integration |
| Analytics Depth | Basic (conversions, downloads) | Basic | Advanced (MRR, Churn, LTV, Refunds) |
| Best Use Case | Testing IAP for Android games | Simple regional adjustments | Complex subscription testing and global scaling |
"The analysis you can conduct based on app store data alone ranges from fairly limited to nearly useless, and it is only suitable for very small businesses with low engineering bandwidth." - Jakub Chour, Head of Growth, HER [3]
Native app store tools are perfect for quick, low-risk experiments on one-time products. However, if you're working with subscription models or managing multi-platform apps, server-side platforms provide the depth and flexibility needed to refine pricing strategies across regions.
Next, we’ll dive into analyzing test data and fine-tuning regional pricing strategies.
Analyzing Test Results and Adjusting Prices
Once your pricing experiments are underway, the next step is to dive into the results and make informed adjustments. This process is all about interpreting the data and identifying which pricing strategies should be scaled.
Metrics to Track During Tests
To get a complete picture of pricing performance, look beyond surface-level metrics like basic conversion rates. Key indicators such as Average Revenue Per User (ARPU), Lifetime Value (LTV), conversion rates, and churn rates provide deeper insights. For instance, a price reduction might boost conversions but could also lead to increased churn, undermining long-term profitability.
It’s equally important to monitor subscriber behavior - active, churned, and refunded users - alongside revenue trends. This holistic view helps pinpoint whether issues stem from pricing or other factors. For example, if conversion rates in certain regions lag behind the U.S. by a factor of five, the problem might not be your product but rather a mismatch between pricing and market expectations [6].
Pricing changes take time to reveal their full impact, especially on retention and LTV. Allow a testing window of 3–6 months to gather meaningful data [6]. Once you’ve collected these metrics, the challenge shifts to translating raw numbers into actionable insights.
Reading and Understanding Test Data
After identifying the right metrics, interpreting the results requires a structured approach. Before running any test, calculate the Minimum Detectable Effect (MDE) to ensure you’ll have enough data for reliable conclusions [6]. Small pricing changes often yield inconclusive results, so testing larger price variations - like $39 versus $69 - can provide clearer insights [6].
While achieving statistical significance is important, don’t overlook practical significance. For example, a slight uptick in conversions may not justify the operational costs if it doesn’t lead to meaningful improvements in LTV or retention.
Expanding Winning Prices to More Regions
Once you’ve identified a successful pricing strategy, the next step is to scale it to additional markets. Keep existing subscribers on their current plans to avoid triggering churn, particularly with Apple’s opt-in requirements for price changes [6]. Instead, roll out the new pricing to regions with similar characteristics, using your test data as a guide.
For instance, if a price reduction proves effective in Brazil, consider applying similar adjustments in markets like Mexico or Southeast Asia. Platforms like Mirava use pricing indexes informed by data from Netflix, Spotify, Apple, and YouTube to calculate region-specific prices across 170+ countries. This upstream intelligence helps fine-tune pricing strategies, while tools like RevenueCat and Adapty handle implementation through billing and paywall management.
As you scale, keep a close eye on secondary metrics. For example, non-gaming app spending grew by 31% in Brazil, 26% in Mexico, and 21% in South Korea in 2025 [6]. These growth figures highlight regions where pricing adjustments could unlock untapped potential. If strong engagement is paired with low conversion rates in these areas, targeted pricing tweaks may drive significant revenue growth.
Best Practices for Regional Price Testing
Running effective regional pricing tests demands a thoughtful approach that moves beyond simple experimentation. By testing with intention, leveraging automation, and steering clear of common mistakes, you can achieve actionable insights and avoid inconclusive outcomes.
Common Regional Test Types
Once you've grouped regions strategically, focus on markets where conversion rates from downloads to purchases suggest pricing misalignment. For instance, if a region’s conversion rate lags significantly behind your top-performing market, it's worth revisiting your pricing strategy there [6].
When conducting tests, opt for "big swing" pricing to uncover clear patterns. Experiment with notably different price points - like $39 versus $69 - to gauge price elasticity [6]. A three-variant approach often works best: a baseline price tailored to local purchasing power, a premium price 20% higher, and a volume price 20% lower. This setup helps capture a range of consumer responses.
Your app’s market positioning also plays a role. Apps targeting a broad audience may benefit from aggressive regional price adjustments, while premium apps might need to maintain higher pricing to preserve their brand image [6]. In price-sensitive regions, reducing prices can significantly improve trial and subscription conversions without requiring additional traffic.
Next, let’s look at how automation can simplify these tests and improve pricing precision.
Using Automation and Pricing Intelligence Tools
Managing pricing across more than 170 countries manually is a daunting task. This is where pricing intelligence platforms like Mirava come in. Acting as the pricing layer upstream, Mirava helps determine optimal price points for each region. It integrates seamlessly with tools like RevenueCat, Adapty, Purchasely, and Superwall, which handle billing, paywall implementation, and entitlements. Mirava’s pricing indexes draw from data sources such as Netflix, Spotify, Apple, and YouTube, providing insights into digital purchasing behaviors across global markets.
The platform also automates psychological pricing adjustments by rounding to regionally familiar endings like .99, .95, or .00, aligning with local buying habits. Additionally, it enables no-code price updates, eliminating the need to submit new app binaries.
Many teams avoid touching regional pricing simply because doing it by hand feels like too much work. With the right tooling, they can test new strategies without wrestling with spreadsheets or App Store rules, turning pricing into a genuine lever for growth.
Mirava’s centralized dashboard offers a unified view for managing pricing across platforms like iOS, Android, and Stripe, ensuring consistency in strategy. For those just starting out, Mirava provides a free plan with account connection, a price audit, and flat price updates. The Premium plan, priced at $49 per app per month ($499 per year, 2 months free), includes advanced capabilities like willingness-to-pay algorithms and batch price updates. By taking the heavy lifting off your plate - with changes applied on your approval or within rules-based caps - Mirava allows you to focus on strategic decisions while tools like RevenueCat, Adapty, Purchasely, and Superwall handle operational aspects like billing and entitlements.
Conclusion
Adjusting your app's pricing to match regional economic conditions ensures its value resonates with diverse audiences. Leading developers approach pricing as a dynamic process, consistently tweaking strategies based on data and performance rather than settling for a static, one-size-fits-all model.
Still, around 40% of brands stick to default app store pricing, often ignoring differences in local purchasing power [6]. This oversight is costly, especially when you consider the growth in non-gaming app spending in emerging markets - Brazil grew by 31%, Mexico by 26%, and South Korea by 21% - showcasing the untapped revenue potential of fine-tuned regional pricing [6].
To make the most of your pricing strategy, start by focusing on your primary markets, using insights from early testing to guide your efforts. Pay close attention to metrics like Lifetime Value (LTV) and retention over a 3–6 month period. While short-term conversion boosts are encouraging, they can sometimes hide deeper challenges in customer value [6].
Managing pricing on a global scale can be complex, but automation simplifies the process. Tools like Mirava provide pricing intelligence upstream, while platforms such as RevenueCat, Adapty, Purchasely, and Superwall handle billing, paywalls, and entitlements. By combining these resources with a data-driven mindset, you can fine-tune your regional pricing strategy and drive sustained growth.
FAQs
How do I pick regions that are best for price testing?
To choose regions for price testing, target areas with noticeable differences in economic conditions, buying habits, and demand trends. Rely on data-driven strategies such as Purchasing Power Parity (PPP) to establish prices that align with local affordability levels. Focus on regions where there’s room for revenue growth, and use tools like Mirava to simplify pricing tests while tracking key metrics like conversion rates, Lifetime Value (LTV), and Customer Acquisition Cost (CAC).
How long should a regional price A/B test run to be reliable?
When conducting a regional price A/B test, it’s important to let it run for 1–2 weeks. This timeframe allows for natural variations in user behavior and ensures there’s enough data to draw reliable conclusions. Cutting the test short can result in misleading outcomes, as short-term fluctuations may not reflect broader trends.
How can I test subscription prices across iOS and Android without breaking analytics?
To experiment with subscription pricing without affecting your analytics, leverage controlled A/B testing with well-defined user segments. Assign users to groups at random, each exposed to different price points, and monitor key metrics such as average revenue per user (ARPU), retention rates, and conversion rates. Tools like RevenueCat and Mirava simplify this process, offering features to evaluate outcomes and fine-tune pricing strategies - all while preserving accurate analytics and ensuring a smooth experience for your users.