One global price is often a revenue leak. If I want to price a mobile app well by region, I need to do five things: define the market and plan, clean price and demand data, estimate elasticity, group markets by sensitivity, and test price changes with care.
In plain terms, I’m looking for three answers:
- Where can I charge more without losing too many conversions?
- Where should I lower price to lift volume and total revenue?
- Where is my data too thin to trust a country-by-country decision?
A few points matter right away:
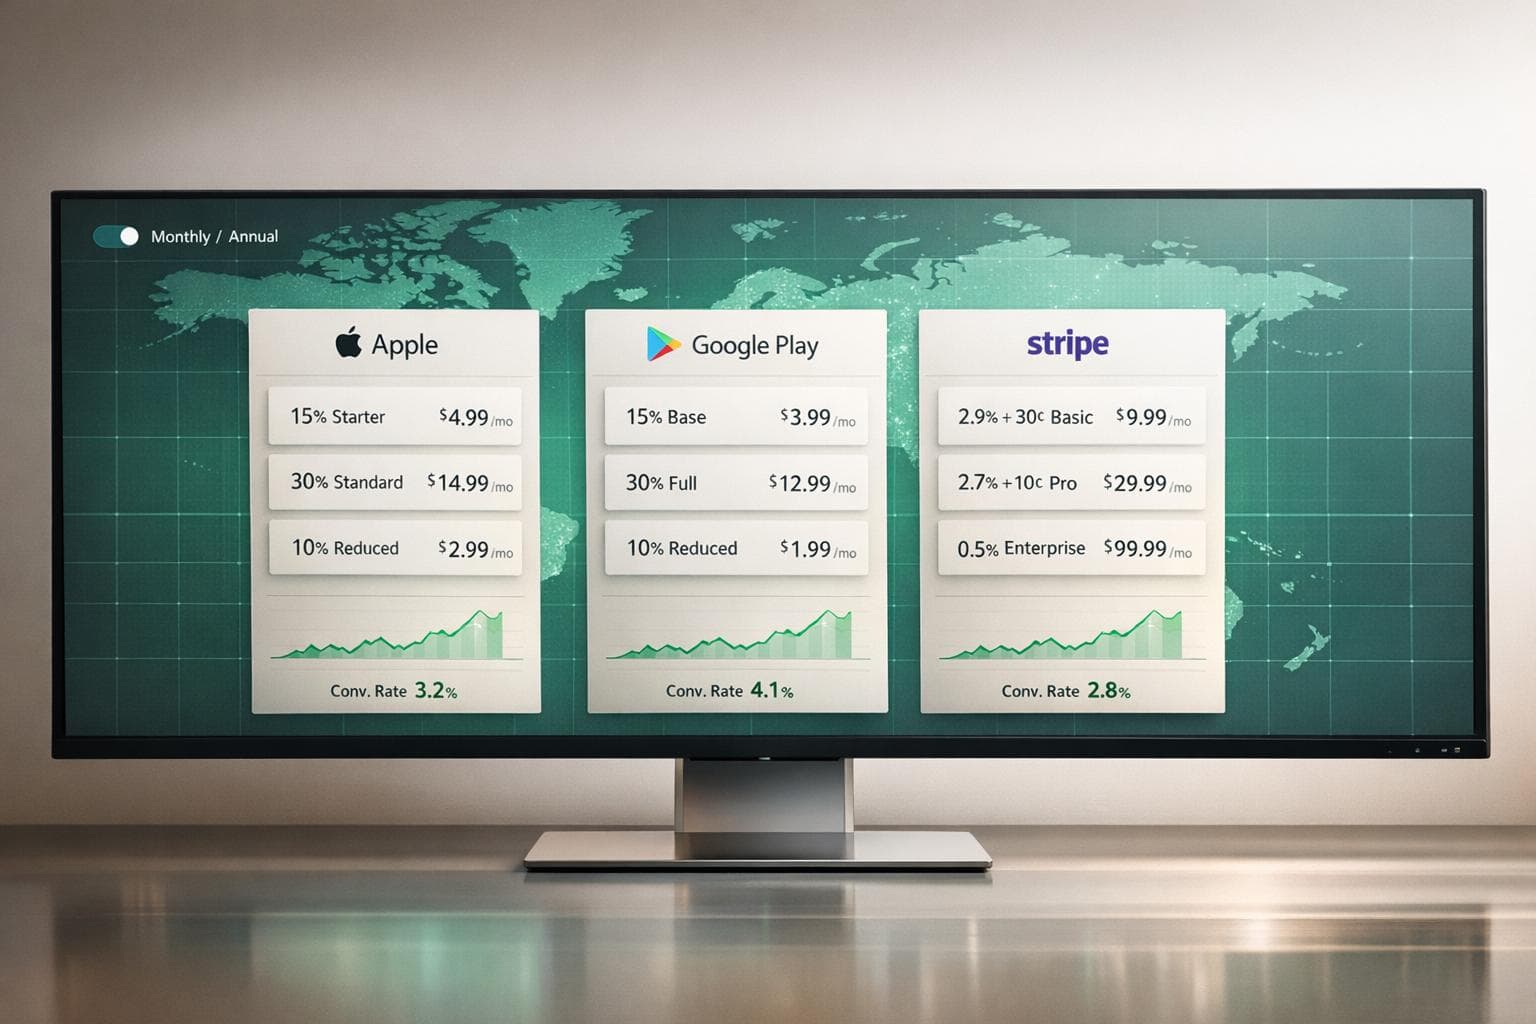
- A price like $29/year can convert fine in the U.S. and poorly in India or Brazil.
- I need at least two clear price points over a 3–6 month window to measure response.
- I should normalise demand with installs or active users, not raw conversions alone.
- For thin markets, I may need regional clusters instead of single-country reads.
- Billing tools like RevenueCat, Adapty, Purchasely, and Superwall execute pricing, while Mirava sits upstream as the pricing intelligence layer.
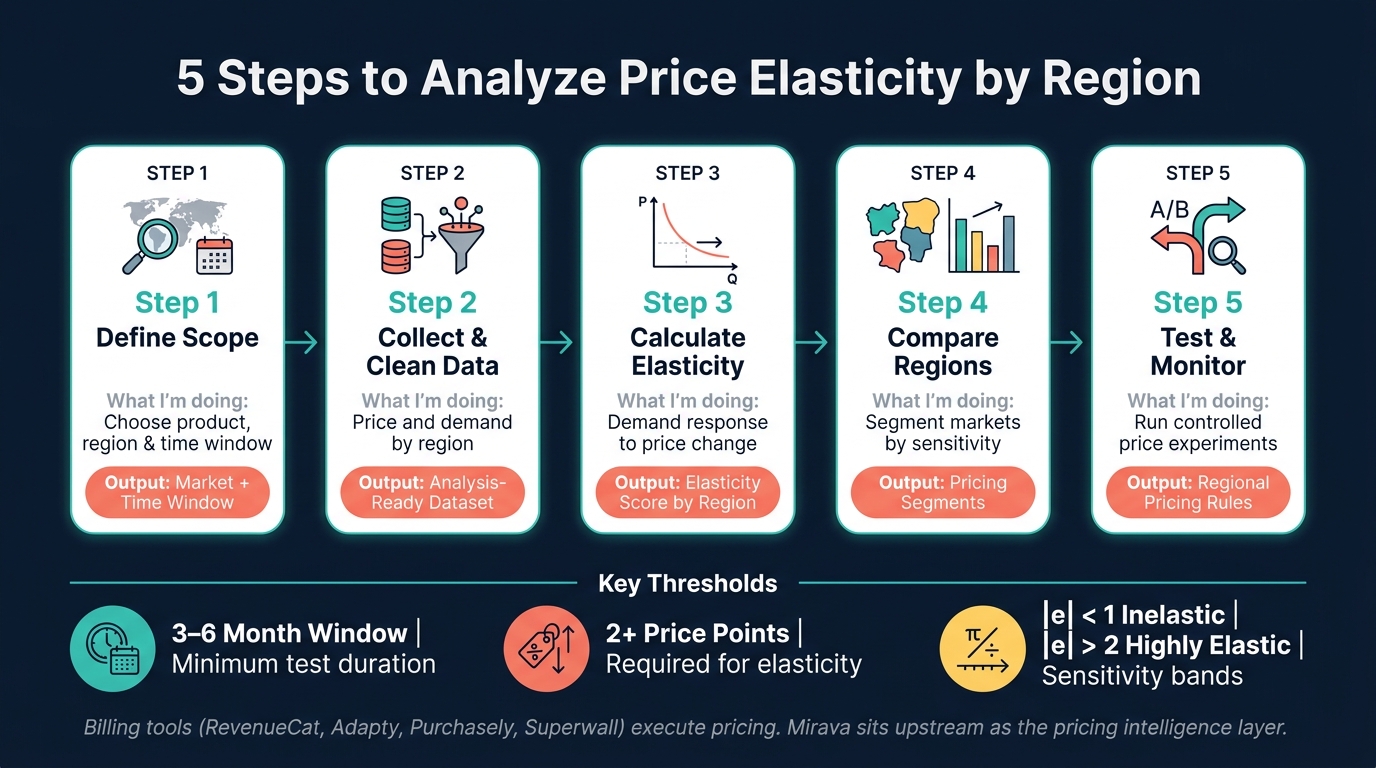
5 Steps to Analyze Price Elasticity by Region
Calculating and Interpreting Price Elasticity of Demand
sbb-itb-43fe43a
Quick comparison
| Step | What I’m doing | What I’m looking for | Main output |
|---|---|---|---|
| 1 | Define product, region, and period | Clean test scope | Market and time window |
| 2 | Collect and clean data | Price and demand by region | Analysis-ready dataset |
| 3 | Calculate elasticity | Demand response to price | Elasticity score by region |
| 4 | Compare regions | Markets to move up, down, or hold | Pricing segments |
| 5 | Test and monitor | Revenue and conversion impact | Regional pricing rules |
If I keep the process tight and use clean regional data, I can make regional pricing decisions based on demand behaviour, not guesswork.
Step 1: Define the Product, Region, and Time Period to Analyze
Choose the products and price points
Before you run any analysis, get precise about what you're measuring. If you sell across many markets, start with your biggest market with the cleanest data. That gives you a baseline to work from. Then look at each product type on its own. Do the same for each plan, since price response and retention often shift a lot between monthly and annual offers [4].
If most of your long-term revenue comes from annual subscriptions, start there. If monthly billing drives the business, begin with monthly plans instead [4]. That decision shapes the dataset you’ll pull in Step 2.
Set regional markets and handle low-volume markets carefully
For markets with solid transaction volume, such as the U.S., Brazil, and India, work at the country level. You’ll get a cleaner read on demand that way. In thinner markets, country-by-country cuts can get noisy fast, so it makes more sense to group markets by similar economic patterns or language, such as DACH, Southeast Asia, or LATAM ex-Brazil. In practice, that means setting prices by market clusters only when country-level volume is too light to measure response with confidence [1][3].
Once you’ve set the market unit, choose a time frame that includes enough price movement to show how demand changed.
Pick a time range that includes at least two price levels
A flat price over the whole period won’t tell you much about elasticity. You need at least two clear price points in the window, and the difference between them needs to be big enough to matter.
"Don't test $39 versus $43 - go bold and try something like $39 versus $69." - Jacob Rushfinn, Founder, Rushfinn Consulting [4]
A 3–6 month window is a good starting point, with at least two meaningful price levels inside it. If a region has strong volume but weak conversion, that’s usually a good candidate for a price test [4].
With the scope locked, the next move is to gather pricing and demand data market by market.
Step 2: Collect and Clean Regional Pricing and Demand Data
Capture the core fields for each region and period
Once the scope is set, the next task is to build a dataset that can support elasticity analysis. Each row should map to one region for one time period. That row needs to show both the price charged and the demand response that followed. Stick to the exact product, region, and date window from Step 1 so every row lines up with a single pricing event.
The table below covers the core fields:
| Data Field | Description | Recommended Format |
|---|---|---|
| Region | Country/storefront | ISO country code (e.g., US, IN, JP) |
| Period | Observation period | MM/DD/YYYY (e.g., 06/18/2026) |
| Local Price | Price in the local currency | Local symbol + amount (e.g., ₹1,499) |
| USD Price | Price converted to USD at a fixed rate | $19.99 |
| Quantity | Number of new paid conversions | Integer |
| Revenue | Total gross revenue for the period | Numeric (USD) |
| Installs | Total new users | Integer |
Use installs or active users as the normalisation base. If you only look at raw conversions, region-to-region comparisons break down fast because the audience size is different [1].
Standardize currency, dates, and number formats
Convert regional values to USD using one fixed FX source, but keep the original local price in a separate column. That gives you a clean comparison layer while keeping the storefront price you may publish later. In practice, this is the kind of upstream pricing prep that sits before billing tools like RevenueCat, Adapty, or Purchasely. If you’re using Mirava, this is the input layer it analyses to help optimise regional pricing.
"Real localized pricing uses Purchasing Power Parity (PPP) as the input, not exchange rates. PPP asks: what rupee number produces roughly the same affordability burden for an Indian user as $19.99 does for a US user?" - Antonio Cappiello, Founder, PricePush [5]
Apple maps prices to preset tiers, so local prices often won’t land on round numbers. For reporting, keep formatting consistent in en-US style: $1,499.00, 06/18/2026, and 1,000.
Remove noise before modeling
Before you run elasticity calculations, strip out periods that muddy the signal. Remove outages, giveaways, major incidents, and promo SKUs because they distort price sensitivity [1]. Put simply, if demand moved for reasons other than price, don’t feed that period into the model.
It also helps to set a quarterly review cycle for markets with high currency volatility. The Turkish lira and Argentine peso, for example, can move 10% to 30% in a single year [5]. That matters. A price that looked fine in January can feel out of line by April, even if the sticker price never changed. In those markets, a monthly spot-check is usually worth doing.
With clean regional data in place, calculate elasticity by region in Step 3 or test regional pricing using A/B experiments.
Step 3: Calculate Price Elasticity for Each Region
Now turn your cleaned regional data into elasticity estimates.
Use the midpoint formula for a quick two-point estimate
The midpoint formula works well when you only have a before and after price point and need a fast read on how demand moved [6].
The formula is: (change in quantity ÷ average quantity) ÷ (change in price ÷ average price)
Using averages instead of starting values helps reduce bias between the two points. For a simple before-and-after check, plug in each region’s price and quantity values and calculate the result with the midpoint formula [6].
Use log-log regression when you have enough observations
If you have enough data points, move to log-log regression. In ln(quantity) = a + b × ln(price), b is the elasticity estimate [6].
This approach gives you a cleaner read because it can control for other factors that move demand, such as seasonality, paid spend, promos, competitor pricing, and CPI [6]. If you’re modelling several regions at once, fixed effects for product, store, or week can help keep the model steady [6].
Classify regions by sensitivity
Once you have elasticity estimates, sort regions by the absolute value of the coefficient. That gives you a practical way to separate markets that can take higher prices from markets that need tighter pricing.
| Sensitivity Level | Elasticity Range | What It Means | Recommended Action |
|---|---|---|---|
| Low | e | < 1 (inelastic) | |
| Medium | 1 < | e | < 2 |
| High | e | > 2 |
Before you classify any region, validate the model with holdout or out-of-sample tests. A region should only be tagged after the model passes that check. If engagement looks healthy but conversions lag, price is likely the issue. If engagement is weak as well, the problem goes beyond pricing [4].
Short-run elasticity often differs from long-run elasticity, so give demand time to settle before judging the result [4][6].
Use these sensitivity bands to compare regions in Step 4.
Step 4: Compare Regions and Build Pricing Segments
Use the elasticity scores from Step 3 to spot which markets can handle higher prices, which ones need lower prices, and which ones need more testing. Then turn that read into pricing segments you can actually use. This process helps address common app pricing questions regarding market-specific adjustments.
Build a regional comparison view
Start with a summary table for your top 10 to 20 markets by volume or revenue. Include the current local price, the U.S. dollar equivalent, install-to-purchase conversion rate, ARPU or ARPPU, and the elasticity band from Step 3. That gives you a clear side-by-side view of where prices should move up, move down, or stay put.
"[Look at] how many free users are coming in. If your conversion rate in India is five times lower than in Canada, Australia, or US, well, there's some mismatch, right?" - Jacob Rushfinn, Founder, Rushfinn Consulting [4]
This is where pricing starts to look less like a finance exercise and more like pattern matching. If a market has low conversion, high drop-off, and a price point that sits well above local buying behaviour, the issue may not be demand. It may just be price fit.
Group markets by pricing strategy
Don’t stop at elasticity labels. Map them to a pricing move.
| Segment | Characteristics | Pricing Action |
|---|---|---|
| Premium / Inelastic | High ARPU, stable conversion | Test small price increases; optimise for LTV |
| Value-Sensitive / Elastic | High volume, low-conversion markets | Apply meaningful price cuts to lift volume [3] |
| Emerging / High-Growth | Rapidly rising spend | Prioritise volume growth; test more aggressively |
These segments should feed straight into the test plan in Step 5. In practice, that means your billing stack, whether it’s RevenueCat, Adapty, or Purchasely, handles execution, while Mirava sits upstream and helps you decide where price changes are most likely to pay off.
Compare price increase versus price decrease scenarios
Use LTV, not just ARPU, when choosing between a higher or lower price. A market with a high ARPU today can still be underpriced if conversion holds and retention stays strong after an increase. On the flip side, lower-income markets often need a more noticeable cut to move conversion enough to lift total revenue [1][2][3].
That distinction matters. A 10% increase in a high-income market may add more value than a broad rollout elsewhere. Meanwhile, a deeper cut in a price-sensitive market can work if the extra volume more than makes up for the lower ticket.
When your own data is thin, Mirava’s regional pricing indexes can act as an outside benchmark. They’re built from Netflix, Spotify, Apple, and YouTube pricing data, so they reflect actual digital purchasing behaviour rather than relying only on GDP or PPP.
Step 5: Apply Findings with Regional Price Tests and Ongoing Monitoring
Use the regional segments from Step 4 to decide where to hold, lift, or lower prices.
Set region-specific pricing rules
Turn those segments into clear pricing rules, with regional floors, ceilings, and rollout rules for new versus existing subscribers [1]. The point is simple: don’t treat every market the same when the demand curve clearly isn’t.
In lower-sensitivity markets, holding price or moving it up can support overall revenue. In higher-sensitivity regions, a lower price point can lift conversion and reduce drop-off at the paywall [2]. That’s usually where teams get more mileage from pricing than from yet another paywall tweak.
Next, pressure-test those rules in a controlled way before pushing them live at scale.
Run controlled experiments through your monetization stack
RevenueCat, Adapty, Purchasely, and Superwall manage billing and paywalls. Mirava sits upstream as the regional pricing intelligence layer, helping teams analyse price bands, recommend regional pricing, and push bulk updates. That split matters: billing tools execute, while Mirava helps shape the pricing decision before it reaches the paywall [1].
Run tests by regional band, not one country at a time, when markets share similar demand patterns [1]. That keeps test design cleaner and gives you a larger sample size faster. For example, if several LATAM or Southeast Asian markets show similar price sensitivity, it often makes more sense to test one pricing rule across the band rather than fragmenting the rollout into tiny country-level experiments.
Conclusion: Recalculate Regularly and Log What Works
Once pricing goes live, watch the full funnel and refresh regional rules on a fixed cadence. Track installs, trials, conversion, churn, and refunds every quarter, and keep a close eye on negative signals after any price increase [1][4].
A simple change log helps more than most teams expect. Log each regional test, what changed, when it changed, and what happened after. That way, the next pricing cycle starts with actual evidence, not guesswork.
FAQs
How much data do I need?
Aim for at least 1,000 users per variant if you want a pricing test you can trust. In most cases, that means running the A/B test for 2–4 weeks so you can pick up different purchase patterns across weekdays, weekends, and user segments. Don’t call the test too early. Wait until you reach a 95% confidence interval before changing price points.
When you review the outcome, keep the roles of each tool clear. Mirava sits upstream as the pricing intelligence layer, helping teams analyse results and recommend optimised price points. RevenueCat, Adapty, Purchasely, and Superwall handle the rest of the monetisation stack: billing, paywalls, and subscriber management.
When should I cluster markets?
Cluster markets once you have enough economic and user behavior data to spot regions that act alike, rather than falling back on default continent-based splits.
Grouping countries by shared market maturity, competitor density, and economic conditions makes pricing easier to manage and more precise. Mirava helps define these tiers and roll out updates, while RevenueCat, Adapty, Purchasely, and Superwall handle billing, paywalls, and entitlements.
How often should I update regional prices?
Review regional pricing at least once a month so you stay in step with market shifts, competitor moves, and seasonal demand.
Managing prices across 170+ countries by hand is slow and hard to keep tight. Mirava can handle region-specific price updates at scale, then pass those price points into RevenueCat, Adapty, Purchasely, or Superwall for rollout. To keep the process grounded in performance, hold back a 5% to 10% control group and compare results before pushing changes across your full user base. That gives you a cleaner read on conversion, retention, and long-term revenue impact.