Pricing your app globally? Start here. Setting the right subscription price for different countries isn't just about converting USD into local currencies. A $19.99 subscription in the U.S. might feel reasonable, but in India, direct conversion makes it ₹1,660 - far beyond what many can afford. This is where Purchasing Power Parity (PPP) and Gross Domestic Product (GDP) come into play. These metrics help developers align prices with local affordability, boosting conversions and revenue.
Key Takeaways:
- PPP adjusts prices based on local buying power, ensuring affordability in price-sensitive regions like India or Brazil.
- GDP reflects a country's average income, making it useful for identifying high-revenue markets.
- Combining both metrics - or using tools like Mirava for smarter regional pricing - can improve revenue by 15–40%.
Quick Comparison:
| Metric | Focus | Best Use Case | Limitation |
|---|---|---|---|
| PPP | Local affordability (cost of living) | Pricing in emerging markets | May lag in volatile economies |
| GDP | National wealth (average income) | Market prioritization | Doesn't reflect income inequality |
Next Steps: Audit your app’s pricing in key markets like India, Brazil, and Turkey. Use PPP to adjust for affordability and GDP for market prioritization. Tools like Mirava can refine this process by factoring in regional spending habits and pricing norms.
Using PPP for Regional Pricing
What PPP Is and How It Is Measured
Purchasing Power Parity (PPP) is a pricing method that focuses on the local buying power of currencies rather than just their exchange rates. Instead of asking how much one currency converts to another, PPP considers how much a standard "basket of goods" costs in different countries. This approach helps ensure that pricing reflects what people in each region can afford, making it particularly relevant for developers tailoring prices to global audiences.
Two primary sources provide PPP data: the World Bank, which updates annually and includes data for around 190 countries, and the International Monetary Fund, which releases updates twice a year [4]. For app developers, PPP offers a way to adjust a base price in USD to align with local income levels and living costs, creating a price that feels fair and accessible to users [1].
A well-known example of PPP in action is the Big Mac Index. For instance, while a Big Mac costs $5.69 in the U.S., it’s only $2.50 in India, illustrating how local affordability influences pricing [5].
Where PPP Works Well for App Pricing
PPP-based pricing is particularly effective for apps targeting large consumer markets in regions where nominal exchange rates do not align with local purchasing power. Countries like India, Brazil, Indonesia, and Nigeria often see significant disparities, with currency-converted prices sometimes being 300–500% higher than those adjusted using PPP [6].
"PPP-based pricing means the same subscription costs less in India or Brazil than in the US, matching what users can actually pay." - PricePush Glossary [4]
Adopting PPP-adjusted pricing instead of flat USD rates has shown revenue increases of 20–50% in some international markets. For instance, a $19.99 subscription in the U.S. might account for around 0.4–0.5% of the average monthly disposable income. However, in Brazil, that same price could represent nearly 4%, making it far less affordable without adjustments [3].
Where PPP Falls Short
Despite its benefits, PPP has limitations that developers need to consider.
One major issue is data lag. Since updates are typically annual or semi-annual, PPP figures might not reflect sudden economic changes in volatile markets like Turkey, Argentina, or Egypt [4]. This can lead to outdated pricing that doesn’t match current realities.
Another challenge is that PPP is rooted in the cost of physical goods - like food or housing - rather than digital products. A consumer's willingness to pay for a fitness app or a productivity tool may not align with what they spend on essentials like groceries [1].
Lastly, raw PPP calculations often produce awkward or unattractive price points, which can feel impersonal or overly mechanical to users. Without adjustments for local pricing strategies, such as charm pricing (e.g., $9.99 instead of $10), these figures might hurt conversion rates. For this reason, PPP should be viewed as a starting point for pricing, not the final solution. Supplementing it with other indicators like GDP or local spending habits can help refine pricing strategies for emerging markets further.
sbb-itb-43fe43a
GDP Fully Explained: Per Capita, PPP, Nominal
Using GDP for Regional Pricing
While PPP adjusts prices based on local purchasing power, GDP provides a broader perspective by reflecting the average economic output per person.
What GDP Is and Its Main Variants
Gross Domestic Product (GDP) measures the total economic activity within a country. For pricing strategies, GDP per capita - calculated by dividing total GDP by the population - is particularly useful. This figure gives a general sense of the average income available to individuals, helping you scale prices up or down across different regions.
There are two main variants of GDP data that developers often encounter:
- Nominal GDP per capita: Reflects income in current U.S. dollars, without adjusting for cost-of-living differences.
- GDP per capita adjusted for PPP: Accounts for cost-of-living variations, offering a more refined view of economic capacity.
GDP-based pricing typically adjusts prices relative to U.S. dollars, using a country's average wealth as a benchmark. The International Monetary Fund (IMF) updates GDP data twice a year, making it a reliable source for keeping up with market fluctuations [4].
Where GDP Works Well for App Pricing
The primary advantage of GDP per capita is its accessibility. It covers nearly every country, is free to access, and integrates easily into pricing models. This makes it an effective starting point for tackling the vast income disparities across global markets. For instance, the difference in average income between App Store territories can be as much as 50 times, making uniform pricing strategies impractical [5].
GDP-based multipliers provide a quick, data-driven way to avoid pricing missteps in new regions. Take India as an example: using GDP-adjusted pricing, a subscription could be priced at ₹449 instead of the standard Apple tier price of ₹849. This adjustment makes the offering far more appealing to price-sensitive users [7].
Where GDP Falls Short
While GDP-based pricing is practical, it does have its drawbacks.
The primary issue lies in what GDP measures: total income, not discretionary spending on digital products. As Antonio Cappiello, Founder of PricePush, explains:
"GDP per capita is widely available and easy to plug in, but it tells you how much income exists in a country, not how much of that income translates into discretionary spend on apps." [3]
Even countries with similar GDP per capita can show stark differences in digital spending habits. Factors like attitudes toward software, platform preferences (e.g., iOS vs. Android), and local competition significantly influence willingness to pay - none of which GDP captures [3].
Another limitation is GDP's inability to account for income inequality. Since GDP per capita is an average, it can obscure economic disparities. For example, in markets with high GDP per capita but concentrated wealth, a mid-tier subscription might be unaffordable for a significant portion of the population. This can unintentionally position your app as a luxury in one region while being perceived as a bargain in another [1].
Additionally, in economically unstable markets like Turkey or Argentina, GDP's semi-annual updates may lag behind rapid inflation or currency fluctuations, resulting in prices that quickly fall out of alignment with local conditions [6].
PPP vs. GDP: A Side-by-Side Comparison
PPP vs. GDP for App Pricing: Side-by-Side Comparison
PPP highlights what consumers can afford, while GDP reflects a nation’s overall economic output - two perspectives that are equally important when setting global app prices.
Comparison Table
Here’s a quick breakdown of how PPP and GDP differ in their approach and utility:
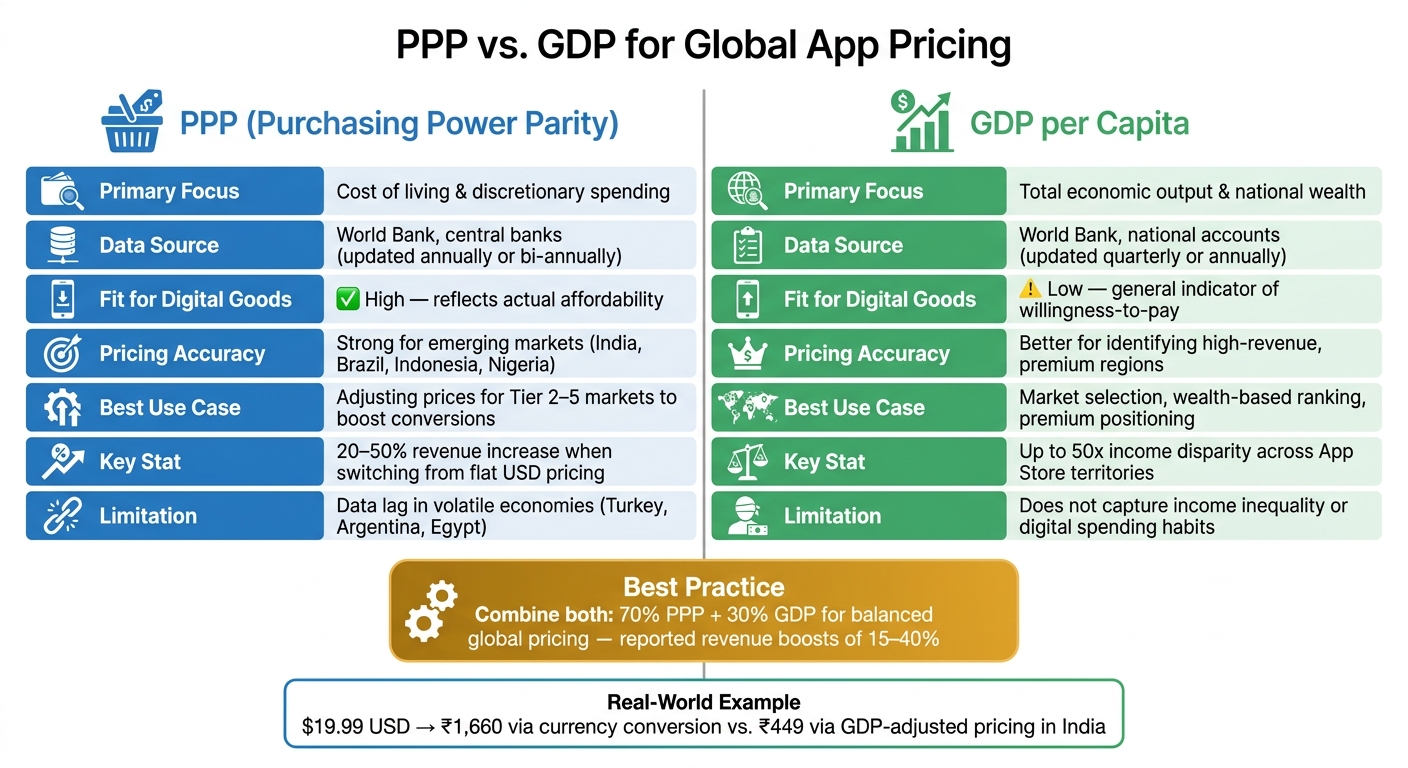
| Feature | PPP | GDP per Capita |
|---|---|---|
| Primary Focus | Cost of living and discretionary spending | Total economic output and national wealth |
| Data Source | World Bank, central banks [3] | World Bank, national accounts [5] |
| Update Frequency | Annually or bi-annually [3] | Quarterly or annually [5] |
| Fit for Digital Goods | High - reflects actual affordability [3] | Low - a general indicator of willingness-to-pay [3] |
| Pricing Accuracy | Strong for emerging markets [3] | Better for identifying high-revenue regions [5] |
| Best Use Case | Adjusting prices for Tier 2–5 markets | Market selection and wealth-based ranking |
When to Choose PPP
If your focus is on conversion, especially in price-sensitive regions, PPP is your go-to metric. For instance, in countries like India, Indonesia, Egypt, and Nigeria, direct currency conversions often result in prices 3 to 5 times higher than what locals can reasonably afford [6]. Using flat USD pricing in these areas can significantly hurt subscription rates. PPP provides a more accurate baseline, ensuring your pricing aligns with local purchasing power.
"PPP-derived data is the closest fit. It captures real purchasing power across countries, and it's updated regularly by central banks and the World Bank." - Antonio Cappiello, Founder, PricePush [3]
When to Choose GDP
GDP per capita is ideal for prioritizing markets. If you’re deciding where to launch a paid product or identifying regions that can sustain premium pricing, GDP offers a reliable snapshot of national wealth. It’s also a useful tool for blending strategies.
Some developers combine metrics, using a 70% PPP and 30% GDP formula to balance affordability with revenue goals. This approach prevents extreme underpricing while allowing for slightly higher rates in wealthier markets [5]. For apps aiming to maintain a premium image without alienating users in emerging economies, this mix can strike the right balance.
Going Beyond PPP and GDP With Digital Pricing Tools
Why Macro Metrics Alone Are Not Enough
While PPP and GDP provide a good foundation for understanding economic conditions, they fall short when it comes to capturing how consumers actually spend on digital products. These metrics don't account for discretionary digital spending, price elasticity, or the influence of local subscription habits. For instance, a user's willingness to pay for an app is often shaped by what services like Netflix or Spotify charge in their region. This disconnect means that even if prices seem economically sound on paper, they may not resonate with actual buyers. Advanced tools can bridge this gap by refining these traditional metrics.
How Mirava Improves Pricing Decisions
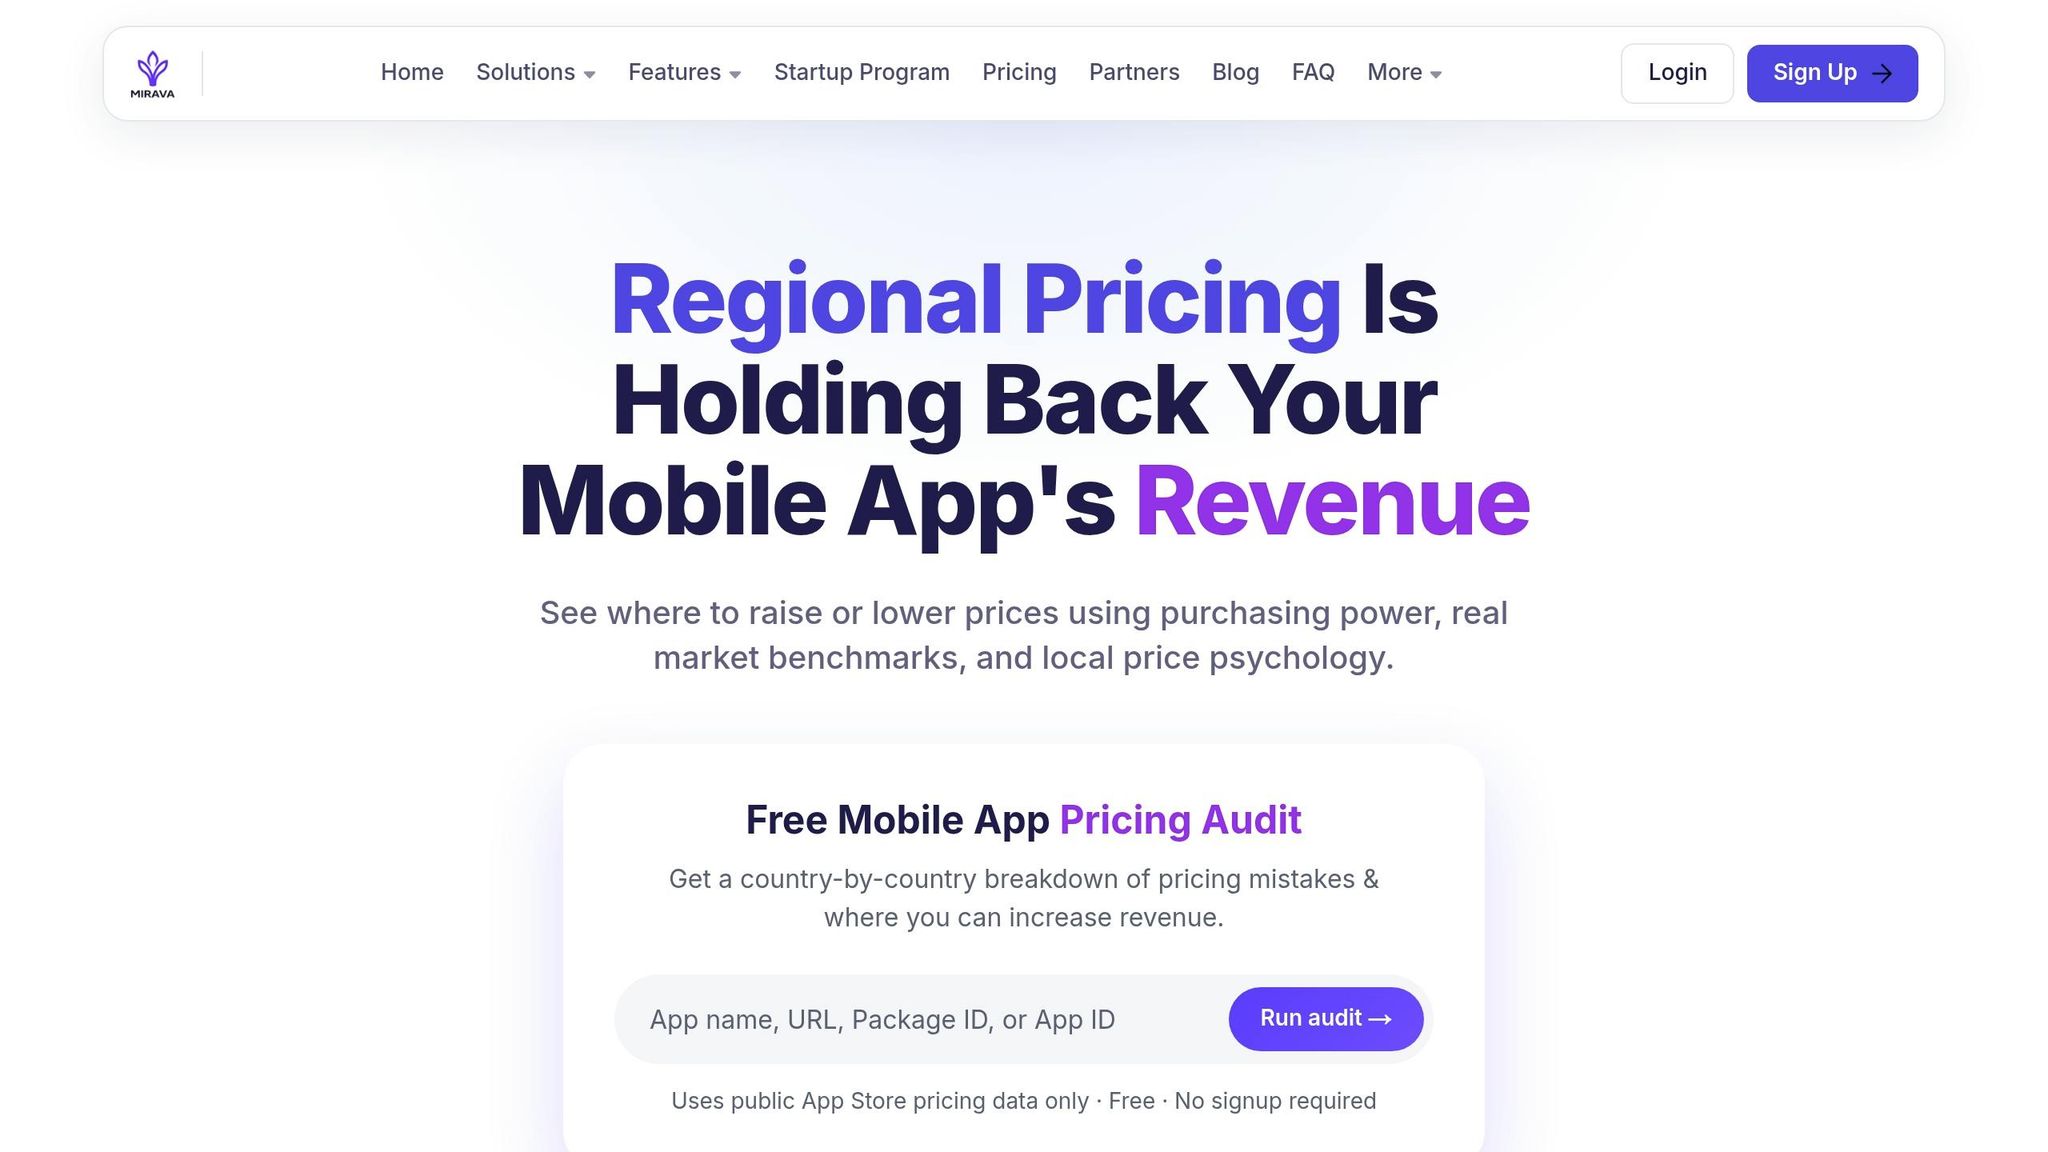
Mirava offers a monetization intelligence platform designed to address the limitations of relying solely on macroeconomic data. Instead of just pulling from sources like World Bank data, Mirava incorporates proprietary digital pricing indexes based on real-world subscription data from platforms like Netflix, Spotify, Apple, and YouTube - companies that have already fine-tuned their regional pricing strategies. By blending these insights, Mirava ensures pricing aligns with local consumer behavior, not just economic theory.
A key element Mirava tackles is subscription norm anchoring. In markets like Brazil, South Korea, or Turkey, users already have an idea of what an app "should" cost, shaped by the global services they interact with daily. Mirava's willingness-to-pay engine factors in these expectations and applies localized psychological pricing rules, ensuring prices not only hit the right number but also feel intuitive to buyers. Apps using this method have reported revenue boosts ranging from 15%–40% [8].
How Mirava Fits Into the App Ecosystem
Mirava operates as the upstream pricing intelligence layer, determining optimal pricing for each market before any billing or paywall systems come into play. After Mirava generates its recommendations, tools like RevenueCat, Adapty, Purchasely, and Superwall handle the next steps: managing subscriptions, entitlements, and paywall configurations.
This creates a clear division of roles. Mirava answers questions like, "What should the price be in Indonesia compared to Germany?" Tools like RevenueCat and Adapty figure out, "How do we bill and manage subscriptions for these users?" Meanwhile, Superwall and Purchasely decide, "Which paywall setup will work best for this user?" By working together, these tools ensure pricing strategies are backed by data while staying adaptable to market demands.
Conclusion: Picking the Right Pricing Metric
Key Takeaways
Switching to pricing based on Purchasing Power Parity (PPP) has shown revenue increases of 20–50% [3]. While neither PPP nor GDP per capita is flawless as a standalone pricing metric, each offers useful perspectives. GDP per capita gives a general sense of a country's economic standing but often misses the mark when it comes to understanding what users are willing to pay for a mobile app. PPP, on the other hand, provides a closer approximation of real purchasing power, which helps avoid pricing that might seem excessive in lower-income regions. However, since PPP primarily focuses on physical goods, it may not fully capture the behavior of digital service users, such as those subscribing to mobile apps.
To address these gaps, combining PPP data with digital pricing trends - for instance, benchmarks from services like Netflix or Spotify - can result in more precise pricing strategies. Tools like Mirava can further enhance this approach by integrating these metrics into an actionable pricing strategy.
Next Steps for App Developers
Use these insights to fine-tune your app's pricing. For instance, charging ₹1,660 in India for a subscription priced at $19.99 in the US indicates reliance on simple currency conversion rather than genuine localization, which can result in missed revenue opportunities [4].
Start by auditing your pricing model. Focus on 8–12 key markets, such as India, Brazil, Turkey, Indonesia, Vietnam, and Egypt. Group these markets into tiers like Premium, Established, Growth, and Emerging, and then track conversion rates and revenue over a 30-day period before making further adjustments [1][2]. Keep in mind that pricing is not a one-time decision but a dynamic process that evolves with ongoing data collection and analysis.
FAQs
How do I calculate a PPP-based price for my subscription?
To determine a price based on Purchasing Power Parity (PPP), start with your US base price and apply this formula: Country price = (PPP factor of target country ÷ PPP factor of base country) × base price. Since the US PPP factor is 1, this simplifies calculations when using the US as your base.
Once you've calculated the price, align it with the closest price tier available on your platform. Tools like Mirava can handle this process efficiently, while services such as RevenueCat, Adapty, Purchasely, and Superwall take care of billing and paywall management.
When should I use GDP per capita instead of PPP for pricing?
When you need a straightforward and commonly accessible measure of regional income, GDP per capita works well. However, it’s a general metric that overlooks actual disposable income and spending patterns. For setting more precise app prices, Purchasing Power Parity (PPP) or behavioral indexes - like those offered by Mirava - are better choices. These tools provide deeper insights into local purchasing behaviors and affordability.
How often should I update regional prices in volatile markets?
In markets experiencing rapid changes, it's crucial to adjust prices considering both economic conditions and platform requirements. For regions with stable economies, reviewing prices annually or semi-annually might suffice. However, in high-volatility areas like Turkey or Argentina, quarterly updates are often necessary due to inflation and periodic store-level adjustments. Mirava allows you to make these updates quickly - within 24–48 hours. You can then apply these changes seamlessly using tools like RevenueCat, Adapty, Purchasely, or Superwall, which manage billing and paywalls efficiently.