If you price every market by FX conversion, you will misprice most of them. What looks normal at $9.99/month in the U.S. can land as premium, awkward, or out of reach elsewhere, which hurts conversion, paid growth, and retention.
Here’s the short version:
- FX is not affordability. Exchange rates convert currencies, but they do not show what people can spend in each country.
- PPP is a starting point, not the finish line. You still need local demand, category norms, and competitor checks.
- Display matters. Prices like ₹827.43 or ₱202.33 look store-made and can lower trust at the point of purchase.
- Manual pricing breaks at scale. Once you manage many countries, plans, and platforms, drift and inconsistency creep in fast.
- Regional pricing needs review to ensure it continues to drive growth. Country performance, taxes, FX moves, and competitor changes all shift the right price over time.
A simple way to think about it: I’d set pricing logic upstream, then let billing and paywall tools do their own jobs. In practice, that means using Mirava for pricing analysis and recommendations, while tools like RevenueCat, Adapty, Purchasely, and Superwall handle billing, entitlements, and paywalls.
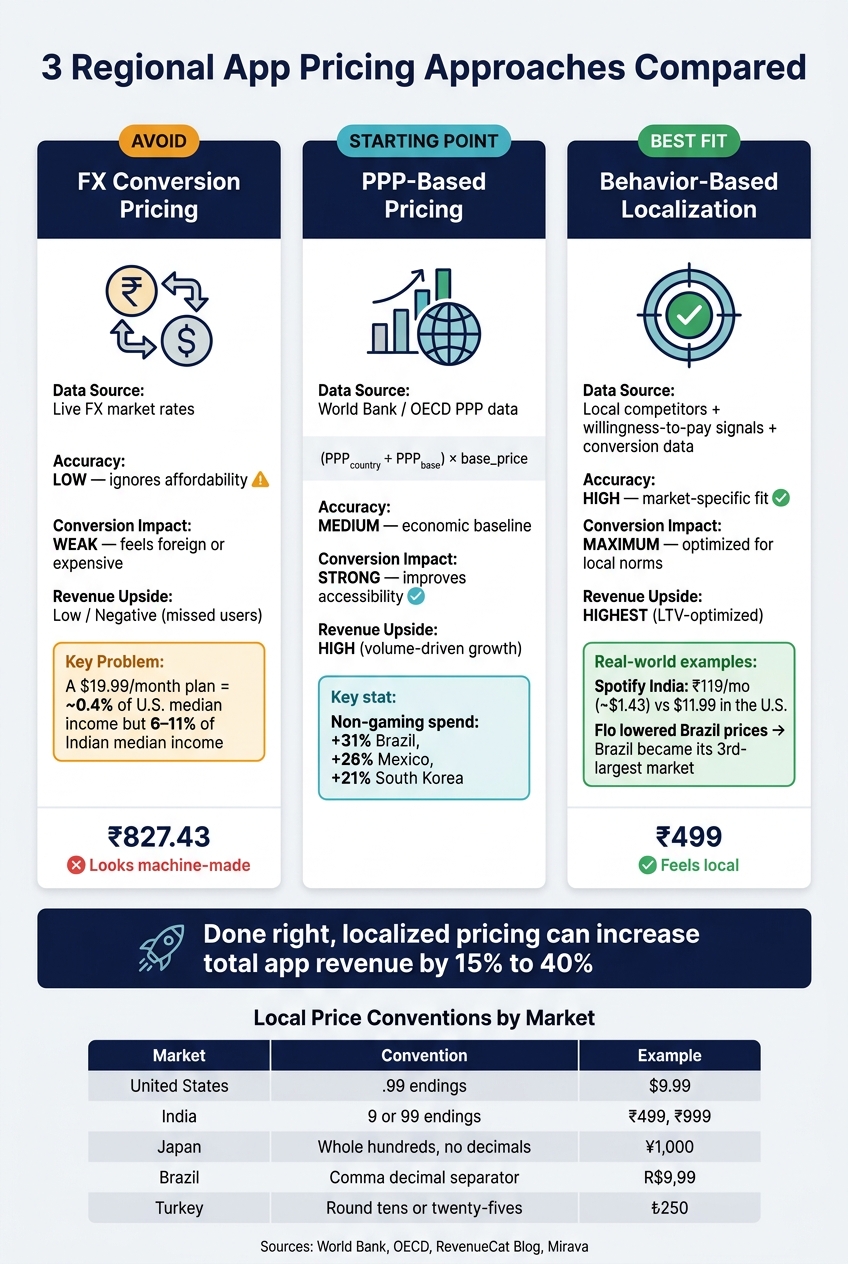
3 App Pricing Approaches: FX vs PPP vs Behavior-Based Localization
Quick Comparison
| Approach | What it uses | Main issue | Best use |
|---|---|---|---|
| FX conversion | Exchange rates | Ignores local spending power and price norms | Basic fallback only |
| PPP-based pricing | PPP data from sources like World Bank/OECD | Too broad on its own | Starting benchmark |
| Local behaviour pricing | Competitor prices, conversion, plan mix, WTP signals | Needs country-level review | Best fit for market pricing |
If I had to boil the article down to one line, it would be this: price by market, present prices like a local app, understand how localized pricing works in stores, and review country results on a schedule.
sbb-itb-43fe43a
Mistake 1: Converting U.S. prices by exchange rate instead of pricing by market
Why exchange-rate pricing underperforms
Auto-conversion gives you a number, not a pricing plan. That’s why FX conversion is often the first regional pricing mistake teams make.
The issue gets obvious fast in lower-income markets. A $19.99/month subscription is about 0.4% of median U.S. monthly income. If you convert that straight into Indian rupees, the same plan can eat up 6% to 11% of median monthly income in India.[3] That gap is huge.
In markets like Turkey or Argentina, there’s another problem. FX-based prices drift with the exchange rate, so your price moves even when your team does nothing.[3] On top of that, auto-conversion often spits out numbers like ₹827.43. Prices like that feel machine-made, not set with any care, and they hint that the developer didn’t think much about the local market.[2]
The fix: use region-specific pricing inputs, not currency math
Start with local signals, not currency conversion. Good regional pricing should reflect PPP and category norms, and local competitor pricing, rather than whatever your U.S. price turns into after FX math.
Spotify charges ₹119/month for Premium in India, about $1.43, while the same plan is $11.99 in the U.S.[1] That isn’t simple conversion. It’s a clear choice based on what users in India will pay for a streaming subscription.
Duolingo shows the same pattern from the other direction. It charges more in France and Spain than in the U.S. because learning English carries more job-related value in those markets, which pushes willingness to pay higher.[4]
Mirava sits upstream as the pricing intelligence layer. It uses proprietary indexes built from Netflix, Spotify, Apple, and YouTube data to recommend region-specific pricing across 170+ countries. Tools like RevenueCat, Adapty, Purchasely, and Superwall then handle billing and paywall execution once the price is set.
Comparison table: exchange-rate pricing vs. PPP-based pricing vs. behavior-based localization
The table below makes the trade-off plain. FX conversion is the weakest place to start if you want subscription pricing that fits the market.
| Exchange-Rate Pricing | PPP-Based Pricing | Behavior-Based Localization | |
|---|---|---|---|
| Data Source | FX market rates | World Bank / OECD data | Local competitors and willingness-to-pay signals |
| Accuracy | Low (ignores affordability) | Medium (economic baseline) | High (market-specific fit) |
| Conversion Impact | Weak (feels "foreign" or expensive) | Strong (improves accessibility) | Maximum (optimized for local norms) |
| Revenue Upside | Low/Negative (missed users) | High (volume-driven growth) | Highest (LTV-optimized) |
PPP is the baseline. After that, the job is to test willingness to pay market by market.
Mistake 2: Ignoring purchasing power parity and local willingness to pay
Why GDP alone is too crude for app pricing
GDP per capita is a blunt tool for app pricing. It doesn’t tell you how people think about subscriptions, which price points feel normal, or how much they value a given app category. It also masks sharp gaps in digital spend and local price expectations.
Take an English-learning app. In non-English-speaking markets, it can have clear career value, so users may accept a higher relative price than GDP data would suggest. [4] PPP gives you a starting point. Local demand tells you where the price should land.
The fix: combine PPP with willingness-to-pay signals
Start with PPP as your baseline: (PPP_country / PPP_base) × base_price using World Bank or OECD data. [3] Then pressure-test that number against what the market is telling you.
Look at conversion by country. Check what both global and local competitors charge in the same category. Watch the split between weekly and annual plans. If users keep picking weekly plans over annual ones, that usually points to price sensitivity and tighter cash flow. [4]
Once you have both pieces, you can turn them into a country-level price. Mirava sits upstream as the pricing intelligence layer, blending PPP with behaviour signals to recommend local prices. RevenueCat, Adapty, Purchasely, and Superwall then handle billing, paywalls, and entitlements.
You can see this logic in the market. Flo lowered prices in Brazil through pricing experiments in 2024, and Brazil became its third-largest market. [4] Impulse dropped its annual subscription in Brazil and replaced it with weekly and lifetime plans to fit local spending habits. [4] That’s the point: macro data gives direction, but user behaviour tells you what will sell.
The upside is hard to miss. Non-gaming spend rose 31% in Brazil, 26% in Mexico, and 21% in South Korea in a recent period. [4] Those are not markets to price with a one-size-fits-all rule.
Mistake 3: Neglecting to localize currency display and price presentation
How poor price presentation lowers conversion
Getting the exchange rate right is only half the job. A converted price can still look wrong if it doesn’t match how people in that market expect prices to appear. Once you’ve set the market price, presentation becomes the next lever for conversion.
That’s where many teams slip. The number may be fine in theory, but the storefront can still make it feel foreign. After you choose the right local price, you need to make sure it looks like it belongs there.
Take a user in India or the Philippines. If a $9.99 subscription is auto-converted, they might see something like ₹376.19 or ₱202.33. Technically correct? Yes. Normal-looking? Not at all. Users are used to local pricing patterns, and when a price breaks that pattern, it can make the app feel imported rather than built for them. As Demian Voorhagen puts it:
"Your app should feel made for them, not exported to them. Nobody wants to pay ₱202.33 or ₹376.19. It looks lazy." [6]
That friction hits harder in price-sensitive markets, where awkward-looking prices can chip away at conversion.
The fix: local currency, psychological rounding, and native price points
The goal isn’t just to show a lower number. It’s to show a number that feels normal in that market.
Local pricing patterns vary quite a bit:
| Market | Familiar Convention | Native Price Example |
|---|---|---|
| United States | .99 endings | $4.99, $9.99 |
| India | 9 or 99 endings on larger amounts | ₹149, ₹499, ₹999 |
| Japan | Whole hundreds or thousands, no decimals | ¥500, ¥1,000 |
| Brazil | Comma as decimal separator | R$9,99, R$19,99 |
| Turkey | Round tens or twenty-fives | ₺75, ₺250 |
App Store price tiers and Google Play local-currency entries still need deliberate rounding. Raw conversions often produce awkward outputs, and that’s where conversion starts to leak. [1][3]
It also helps to check what users will actually see in the storefront. The platform may alter the final display, so don’t stop at the value shown in the console. Review the live storefront price instead. [1] A VPN is a simple way to verify the local storefront view. [4]
This is where pricing intelligence sits upstream of billing and paywall tools. Mirava calculates local prices and rounds them in line with market norms. From there, RevenueCat, Adapty, Purchasely, and Superwall handle billing, paywalls, and entitlements. Keep pricing logic separate from billing and paywall delivery.
Price presentation can make a big difference in localisation performance.
Mistake 4: Managing regional prices manually without a clear pricing workflow
Where manual regional pricing breaks down
Getting the local price right is only half the job. The harder part is keeping that price in line across stores, tiers, and markets over time. Manual regional pricing can look fine when you have one app and a small set of plans. Once you scale, it turns into thousands of price cells, and every one of them can go wrong.
Your pricing work also has to move with FX swings, tax changes, store policy updates, and shifts in purchasing power.[7] Apple runs on a fixed price ladder with about 900 points per currency, while Google Play lets teams set local-currency prices more freely.[3] Google also removed Pricing Templates, which means teams need one clear source of truth if they want bulk updates to stay aligned.[1]
The awkward part is that neither store tells you when prices have drifted out of line. You usually spot it later through weaker conversion, lower rankings, or more churn.[7] One useful check is simple: if revenue per install in a market drops by more than 30% while installs stay flat, pricing drift is a likely cause.[5]
The fix: separate pricing decisions from billing and paywall execution
More manual work does not solve this. A cleaner workflow does. Pricing decisions should sit apart from billing and paywall execution.
Mirava handles the pricing layer upstream, with store-ready exports across 170+ countries. RevenueCat and Adapty manage billing and entitlements. Purchasely and Superwall handle paywalls and testing.
"Managing 175+ prices across three platforms is a nightmare. I tried the spreadsheets, I built a Zapier pipeline… It broke constantly." - Demian Voorhagen, RevenueCat Blog [6]
That split makes updates easier to manage and helps teams spot errors before they hit revenue.
Mistake 5: Setting regional prices once and never reviewing country performance
Once pricing goes live, the job shifts from launch to upkeep. Regional pricing is not a set-it-and-forget-it exercise. FX moves, tax rules change, and local demand can drift over time.
What to monitor after a regional price change
One of the clearest early signs of drift is a growing gap between installs and revenue. If installs stay flat in a market but revenue per install starts to slide, your pricing limits app revenue because it is out of step with what users in that country are willing to pay. A drop of more than 30% in a country’s revenue per install versus its 12-month average is worth a closer look [5].
Big conversion gaps across countries usually point to a pricing mismatch.
Track revenue per install, trial start rate, paid conversion, churn, and refund rate by country, not as one blended global number. Country clusters can help here. Looking at high-PPP and low-PPP markets side by side gives you a cleaner view of where pricing is doing its job. If conversion is weak but engagement and retention are healthy, price is the likely problem. If conversion, engagement, and retention are all weak, you’re probably looking at a product-market fit problem instead [4].
The fix: review results on a set schedule and update prices in batches
Not every market needs the same level of attention. A tiered review schedule keeps stable markets on a lighter cadence and gives more volatile ones closer scrutiny [5].
| Market Tier | Example Markets | Review Cadence |
|---|---|---|
| Tier 1 (Stable) | US, UK, Eurozone, Australia, Canada, Japan | Semi-annually |
| Tier 2 (Growth) | Brazil, India, South Korea, Mexico, Southeast Asia | Quarterly |
| Tier 3 (Volatile) | Turkey, Argentina, Egypt, Nigeria | Monthly |
Between scheduled reviews, a few triggers should push you to check sooner:
- a major FX swing
- a storefront tax update
- a spike in refund requests from one region
- a competitor repricing in a market that matters to you
Don’t judge a price change on the first week of data. Look at performance over 3–6 months [4]. Batch updates across markets instead of making one-off edits. That cuts the odds of inconsistent pricing slipping into your catalogue. In this stack, Mirava sits upstream as the pricing intelligence layer, helping teams analyse markets and push bulk updates across 170+ countries, while RevenueCat, Adapty, Purchasely, and Superwall handle billing, paywalls, and entitlements.
Conclusion: Better regional pricing starts with local market logic, not global shortcuts
Regional pricing breaks down when teams treat it like an exchange-rate exercise instead of a pricing job. That’s the thread running through all five mistakes above.
The fix is simple, but it has to happen in the right order. Start with PPP as your baseline. Then adjust for willingness to pay, local category norms, and psychological price points.
"Value isn't universal - it's relative. You're not just competing with other apps, you're competing with the local economy." - Demian Voorhagen, Mirava [6]
After that, execution becomes an ops question. That split matters. Mirava sets market prices upstream, while RevenueCat, Adapty, Purchasely, and Superwall handle billing, paywalls, and entitlements.
Pricing doesn’t stop once the new tiers go live. Teams should review prices on a steady cadence: quarterly in stable markets, monthly where currencies and store conditions move more often. Done well, localized pricing can increase total app revenue by 15% to 40% [8].
FAQs
How do I set my first regional prices?
Start with a solid base price in your primary market, usually the U.S.. From there, use Purchasing Power Parity (PPP) to set baseline prices based on what people can afford locally, rather than just converting currency.
Then adjust for local price psychology and check performance with A/B testing. As you scale, Mirava can help analyse and recommend region-specific prices, while RevenueCat, Adapty, Purchasely, and Superwall handle billing, paywalls, and entitlements.
When should I review prices by country?
Review regional prices on a regular cadence, not as a one-off task. Default App Store and Google Play price tiers often miss local purchasing power, and the market doesn’t stand still. Exchange rates move, local conditions shift, and competitor pricing changes with them.
A practical place to start is your top 10–20 markets by downloads. Look for regions where conversion trails your main market, even though engagement and retention are strong. That’s usually a pricing signal, not a product problem.
When you spot that gap, run a pricing audit and adjust where needed. Mirava can help you analyse willingness to pay and recommend price updates, while tools like RevenueCat, Adapty, and Purchasely handle billing and paywall execution downstream.
Which metrics best show pricing drift?
Look at conversion rates and revenue metrics across your top 10–20 markets. Pricing drift tends to show up when one region converts far below your best-performing markets, especially once product-market fit is already in place.
Track RPU, ARPPU, and churn as well. Those numbers help you spot when pricing no longer fits local purchasing power or where you sit against market benchmarks.
Mirava helps teams set region-specific prices. RevenueCat, Adapty, Purchasely, and Superwall cover billing, paywalls, and subscriber management.