A/B testing is the most reliable way to find the optimal price for in-app purchases without alienating users or leaving revenue on the table. By testing price variations with specific user groups, you can identify what users are willing to pay while maximising long-term revenue.
Key takeaways:
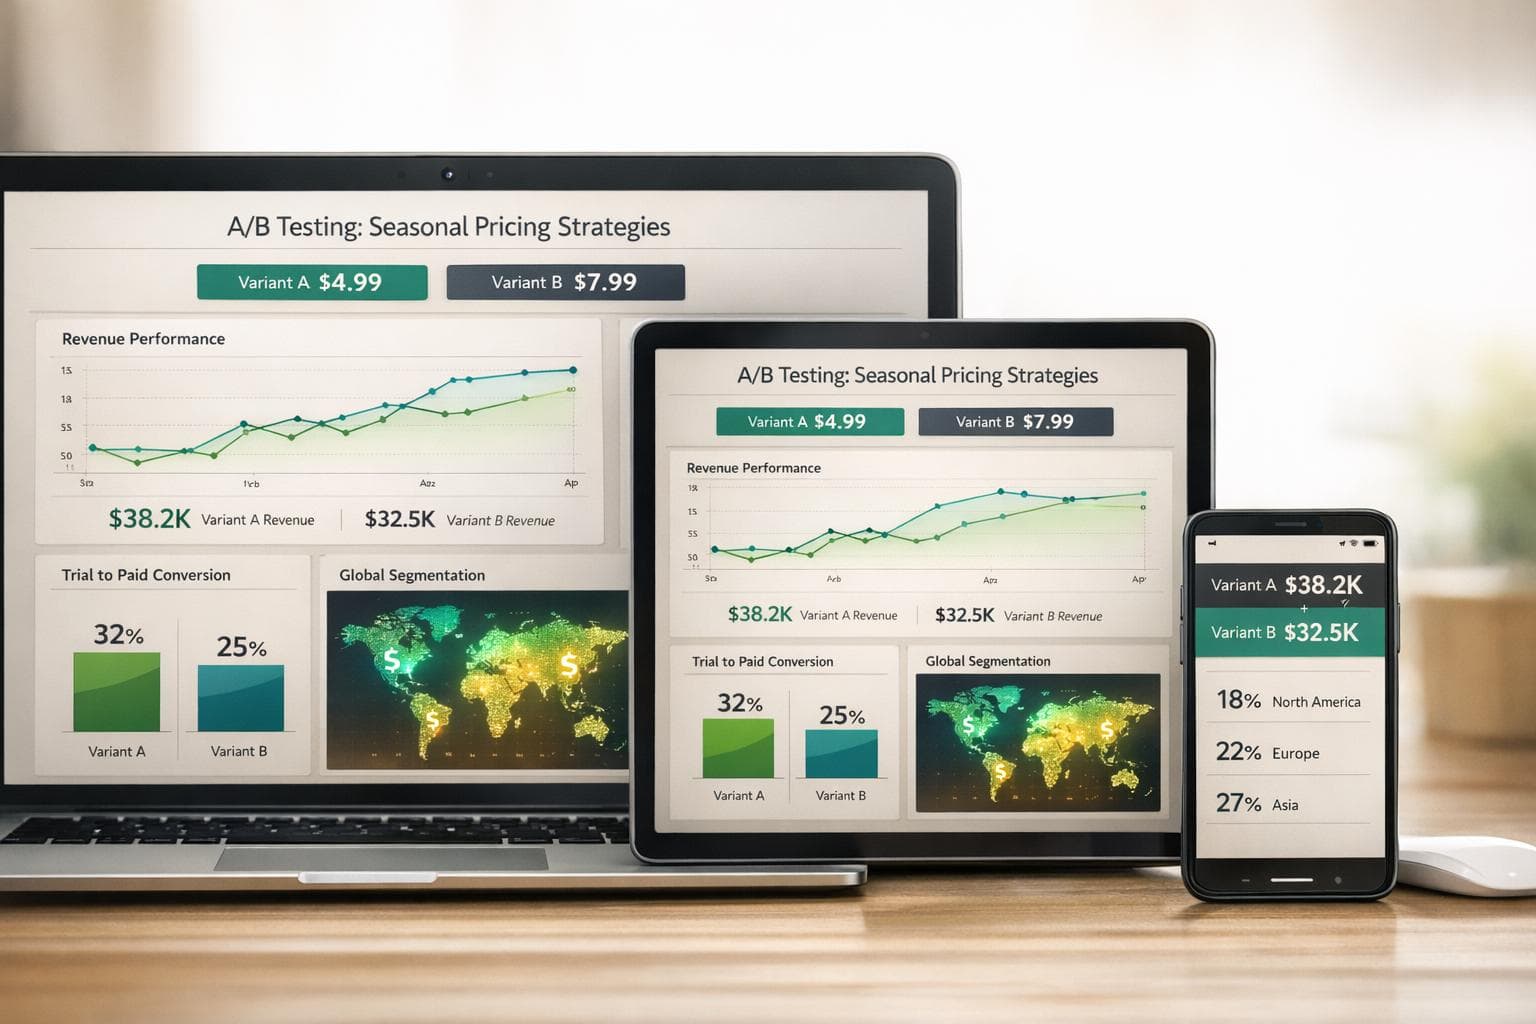
- Why it matters: Pricing impacts conversion rates, ARPPU (Average Revenue Per Paying User), and LTV (Lifetime Value). Regional pricing is especially critical to cater to diverse markets.
- How it works: A/B testing isolates the effect of price changes by comparing a control group (current pricing) with groups exposed to price variations.
- Metrics to track: Focus on LTV, ARPPU, churn, and refund rates for actionable insights.
- Avoid common mistakes: Don’t end tests prematurely, rely solely on initial conversions, or test without accounting for regional differences.
- Tools to use: Platforms like Google Play Console, RevenueCat, and Mirava help implement and analyse pricing experiments effectively.
This guide explains how to run effective A/B price tests and use the results to refine pricing strategies across markets. Start testing smarter today to boost revenue and retention.
A/B Price Testing Basics
Key Metrics for A/B Testing In-App Purchase Pricing
These principles are essential when fine-tuning prices across various markets.
How A/B Testing Works
A/B testing divides users into distinct groups: a control group that experiences your current pricing and treatment groups that encounter the price variations you want to test. This structured approach isolates the impact of pricing changes, separating them from external factors like seasonal trends, marketing efforts, or app store promotions [1].
Through A/B testing, you can explore adjustments to subscription lengths, trial durations, introductory offers, regional pricing, and even feature bundling [1]. Most tests focus on new customers to maintain a consistent experience, while existing subscribers usually stay on their current plans to avoid confusion.
The results are analyzed using confidence intervals to determine whether observed differences are statistically meaningful or just random chance [4]. For example, Google Play uses a 90% confidence level by default, though this can be adjusted between 70% and 99% depending on the desired certainty. Advanced setups can also include multivariate testing (A/B/C/D), enabling multiple variations to be tested simultaneously [5].
Understanding this structure is key to identifying the right metrics for success.
Metrics to Track
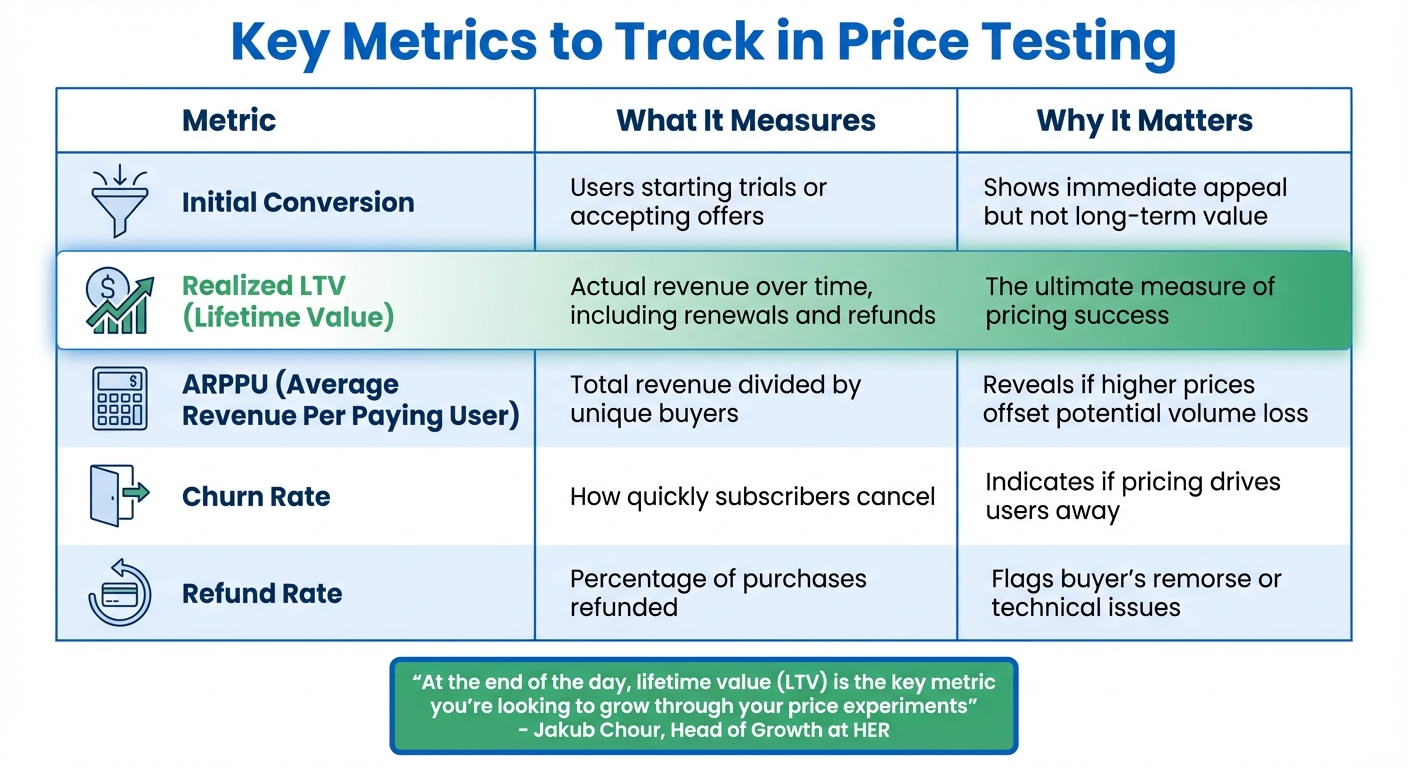
Selecting the right metrics ensures your tests yield actionable insights rather than misleading conclusions. The initial conversion rate measures the immediate appeal of an offer - how many users start a trial or accept a price - but doesn’t reflect long-term value. For instance, a lower price might drive conversions but reduce overall customer lifetime value (LTV).
LTV is critical for assessing the long-term impact of pricing changes. It represents the total revenue a customer generates throughout their relationship with your app, factoring in renewals, upgrades, churn, and refunds [1].
As Jakub Chour, Head of Growth at HER, explains: "At the end of the day, lifetime value (LTV) is the key metric you're looking to grow through your price experiments" [1].
Other important metrics include Average Revenue Per Paying User (ARPPU), which focuses on the revenue generated per buyer at each price point [4]; churn rate, which highlights whether pricing changes are driving users away [1]; and refund rate, which can signal buyer dissatisfaction or issues during the purchase process [1]. Additionally, tracking Monthly Recurring Revenue (MRR) and the buyer ratio (the percentage of monthly active users making purchases) can provide deeper insights into the effectiveness of your pricing strategy [4].
| Metric | What It Measures | Why It Matters |
|---|---|---|
| Initial Conversion | Users starting trials or accepting offers | Shows immediate appeal but not long-term value |
| Realized LTV | Actual revenue over time, including renewals and refunds | The ultimate measure of pricing success |
| ARPPU | Total revenue divided by unique buyers | Reveals if higher prices offset potential volume loss |
| Churn Rate | How quickly subscribers cancel | Indicates if pricing drives users away |
| Refund Rate | Percentage of purchases refunded | Flags buyer's remorse or technical issues |
Common Mistakes to Avoid
Ending tests prematurely, before achieving statistical significance, can lead to incorrect conclusions based on random fluctuations rather than actual improvements [1].
As Jakub Chour cautions, "The hard truth is that even if you have very good test hypotheses, the majority of A/B tests fail to yield a better outcome in the real world" [1].
Focusing on the wrong metrics can also misguide decisions. For instance, while a lower price might boost initial conversions and short-term revenue, it could harm long-term LTV, leaving potential revenue untapped. Relying on tools that track only initial clicks without following the entire subscription journey risks missing the full picture [1].
Another pitfall is the "Novelty Effect", where users respond positively to a new price simply because it’s different, only for the uplift to fade over time [4]. Small sample sizes can also be an issue; apps with limited daily purchases may need weeks or months to achieve statistical significance [1]. Conversely, running tests for too long - beyond six months - can introduce external factors like seasonality or market changes, complicating the results [1].
Platform-specific challenges further complicate testing. On iOS, failing to use unique Subscription Groups for different price points can confuse users, leading to incorrect upgrade options or accidental purchases of multiple subscriptions [5]. On Google Play, grouping interchangeable products (like various tiers of in-game currency) within a single experiment may cause users to switch between products rather than increasing overall spending [4].
These foundational concepts lay the groundwork for exploring platform-specific test setups in the next section.
sbb-itb-43fe43a
Setting Up Price Tests by Platform
Each platform comes with its own tools for running price experiments, each with unique features and limitations. Knowing these differences will help you tailor your approach to suit your app's specific requirements.
Google Play Price Experiments
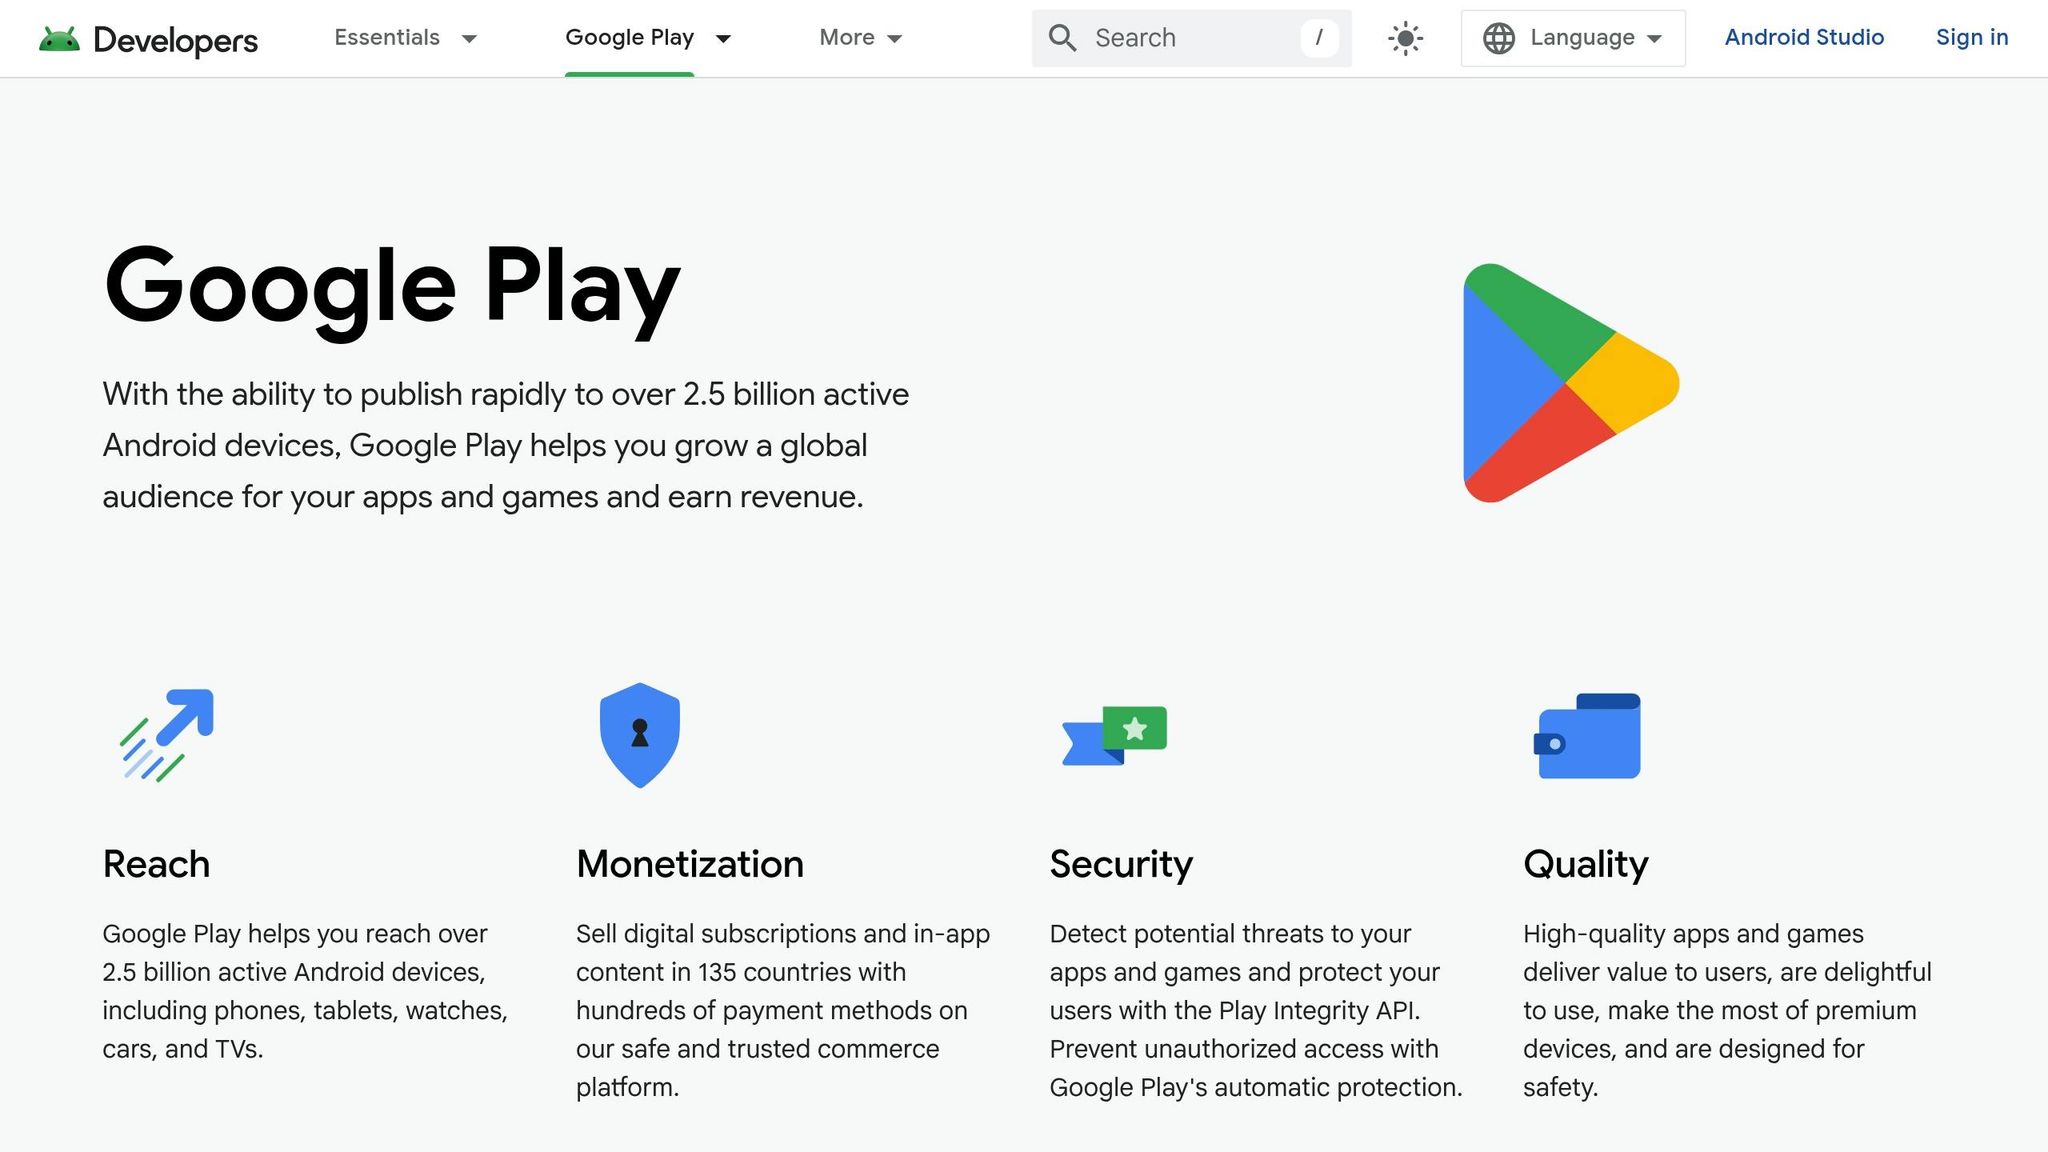
The Google Play Console provides built-in tools for testing pricing strategies on one-time products, such as in-game currency or consumables. To use this feature, you need merchant developer status with permissions to manage store presence and access financial data. Experiments can be configured by country, but note that associated territories (e.g., French Guiana or Polynesia when testing in France) are excluded.
Key features include:
- Up to 1,000 purchase options can be included in a single test.
- You can test up to two price variants against a control group.
- Price changes are allowed within specific ranges: increases between 1% and 999% and decreases between 1% and 99%.
- The default confidence level is set at 90% but can be adjusted between 70% and 99%.
- Experiments can run for up to six months, with prices reverting to the control value 14 days after reaching statistical significance or when the test ends.
- A mandatory 30-day cooldown period applies before launching a new test involving overlapping products or countries.
To prevent cannibalization, include all interchangeable one-time products (e.g., different tiers of in-game currency) in the same experiment. [4]
Using RevenueCat for Price Testing
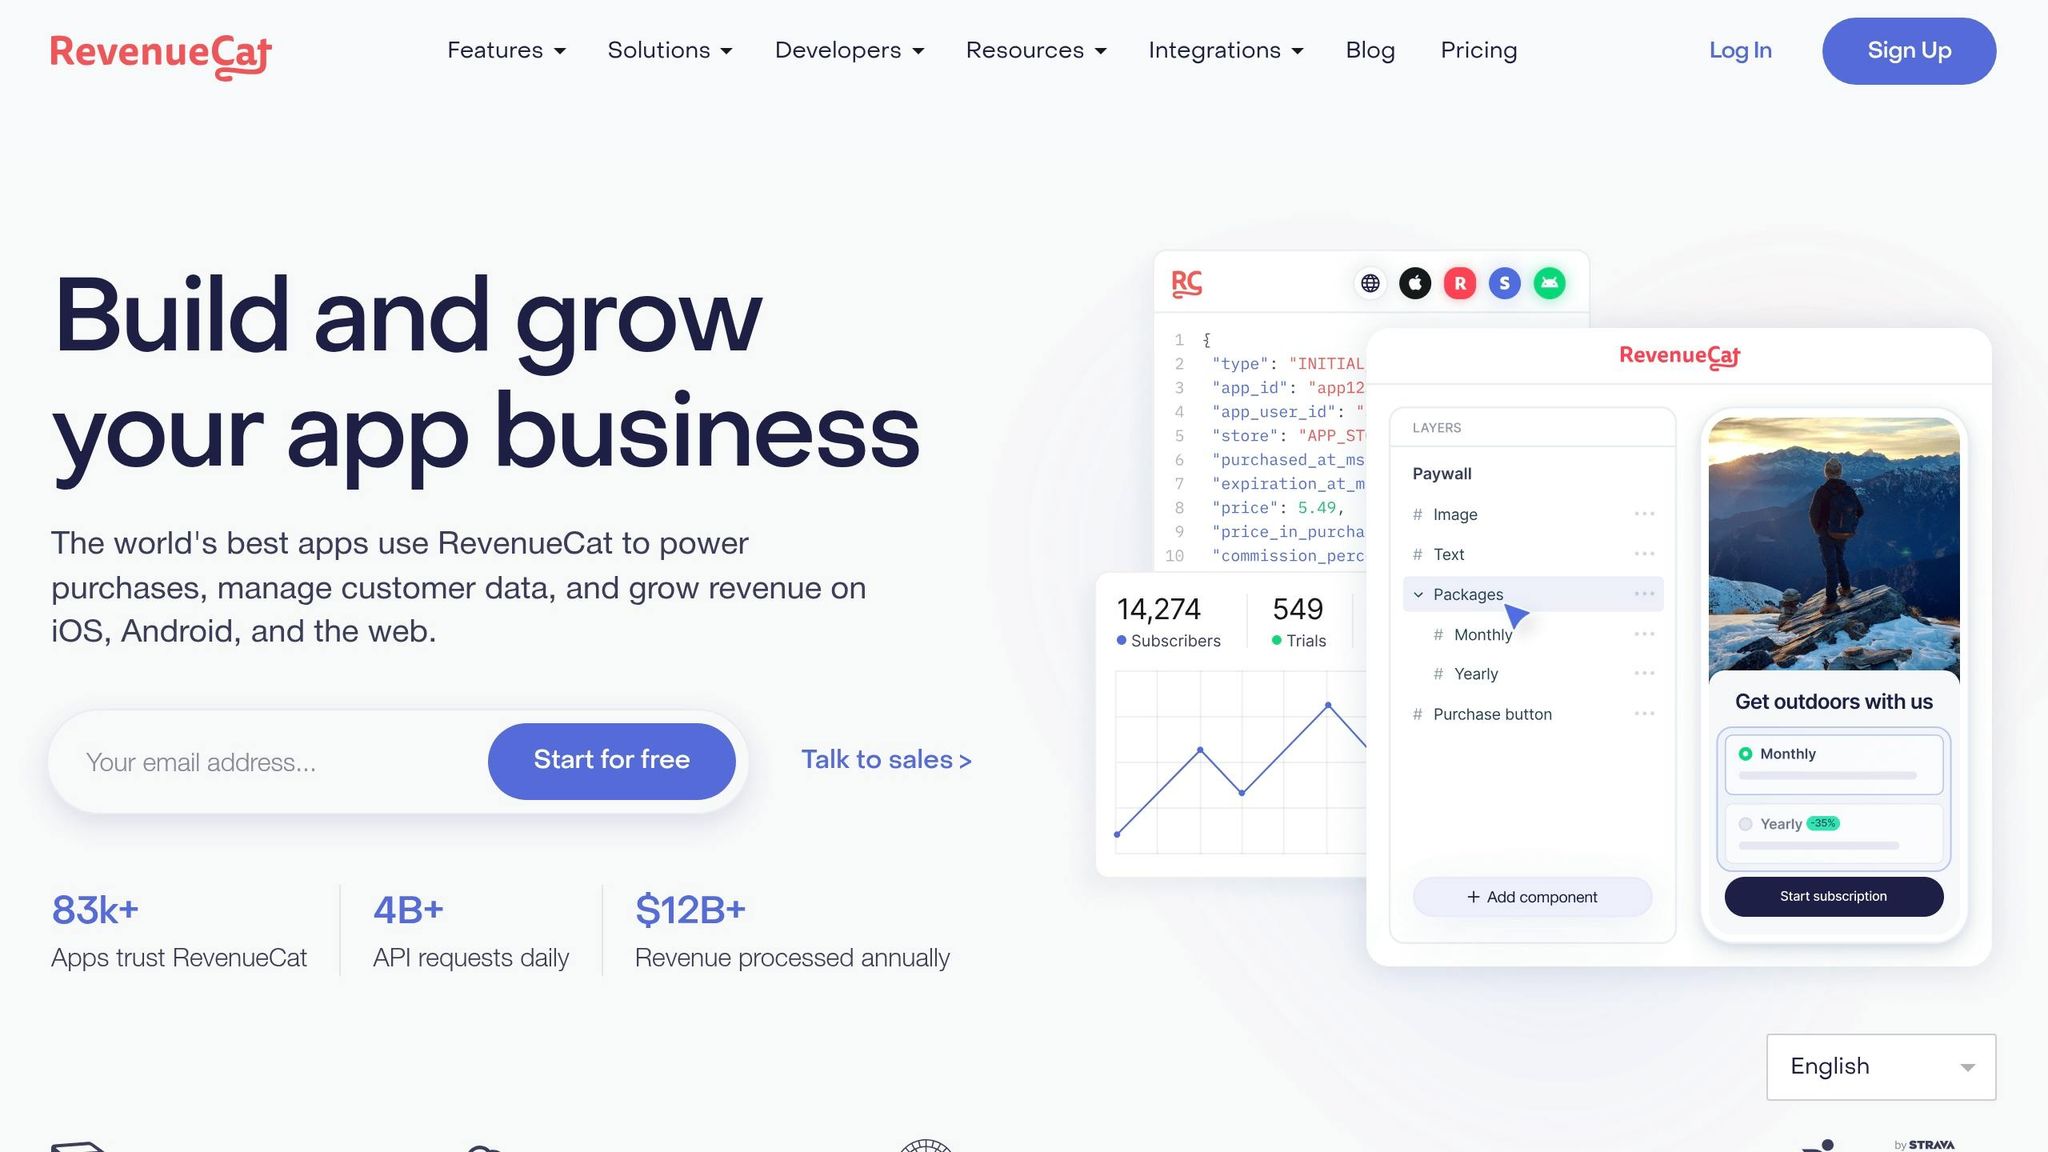
Unlike Google Play, RevenueCat offers a cross-platform solution that works for both subscriptions and one-time purchases. Its offerings-based approach allows you to group in-app products from multiple stores for testing. The Experiments tool randomly assigns users to a control group or up to three treatment variants, enabling multivariate testing without needing to modify your app's code.
For iOS, it's recommended to create a new Subscription Group for each Offering. This ensures customers see only one set of products in their subscription settings, avoiding the risk of multiple accidental subscriptions.
Dominique Yahyavi, Co-Founder of Pixelcut, shared, "Being able to find a variant that produces a 16% increase in subscribers definitely makes RevenueCat worth it." [3]
RevenueCat also features Placements, which allow unique Offerings to appear in different app locations, such as onboarding flows or settings. Results start appearing within 24 hours and remain accessible for up to 400 days. [5][6][7]
| Feature | Google Play Console | RevenueCat Experiments |
|---|---|---|
| Product Type | One-time products only | Subscriptions and one-time products |
| Max Variants | 2 variants + 1 control | 3 variants + 1 control |
| Max Duration | 6 months | No hard limit (results track for 400 days) |
| Targeting | Country/Region | Country, App version, SDK version, Platform |
Sources: [4] for Google Play details; [6] for RevenueCat details.
Working with Other Platforms
Platforms like Adapty, Purchasely, and Superwall can complement Google Play and RevenueCat to refine your app pricing strategy. These tools are particularly effective for designing dynamic, visually appealing paywalls and managing entitlements. While RevenueCat handles billing and experiment assignment, these platforms focus on creating responsive paywalls that align with your pricing tests.
Mirava adds another layer by serving as a pricing intelligence tool. It determines optimal price points based on factors like purchasing power parity, currency fluctuations, and regional competition. This data feeds seamlessly into platforms like RevenueCat, Adapty, or Purchasely for implementation, simplifying the technical side of price testing.
When running experiments across multiple platforms, ensure user segments are mutually exclusive to prevent overlap. For instance, RevenueCat blocks tests from starting if any segment overlap is detected. Additionally, identify users before they reach the paywall to avoid duplicate counts. [6][7]
Analyzing Test Results
Understanding the Data
When evaluating price experiments, lifetime value (LTV) is the key metric to focus on. This measures the total revenue a user generates throughout their relationship with your app. While initial conversion rates provide insight into immediate performance, they don't paint the whole picture. For instance, a lower price might boost conversions initially but could lead to a drop in LTV if users contribute less revenue over time [1].
To get a clearer view of the financial impact, track realized LTV, which accounts for factors like renewals, churn, and refunds. Also, monitor Average Revenue Per Paying User (ARPPU) to see how much each paying customer contributes and the buyer ratio (the percentage of active users making purchases) to understand whether your pricing changes are attracting a broader audience or narrowing it [4].
It's crucial to rely on statistically significant results rather than reacting to early trends. A result is considered statistically significant when the confidence interval for the spend difference does not include zero [4]. For reference, Google Play uses a 90% confidence level, meaning there’s less than a 10% chance that the observed difference is due to random variation. High-traffic apps can often achieve reliable results within 2–3 weeks, while low-traffic apps may require more time [1][4].
Keep in mind that longer experiments, spanning several months, may be influenced by external factors like seasonality or economic changes, which could distort the findings [1][4].
Once you’ve gathered solid data, the next step is to use these insights to refine your pricing strategy through ongoing experimentation.
Running Multiple Tests Over Time
Even when a price variant emerges as a clear winner, it may not remain effective forever. Market conditions, user preferences, and competitive landscapes are constantly changing, so periodic retesting is essential to ensure your pricing remains aligned with these shifts [1].
Insights from one test can guide your next steps. For example, if a small price adjustment (e.g., a 5% increase) doesn't yield a meaningful change, you could experiment with a more substantial adjustment. Before doing so, define an appropriate Minimum Detectable Effect (MDE), which typically falls between 5% and 50% [4].
Segmenting tests by region can help account for differences in market dynamics, purchasing power, and exchange rates. For regions with limited data, consider broadening the test to include more countries or reducing the number of pricing variants to achieve statistical significance faster [1][4].
Applying Results to Regional Pricing
Once you’ve identified the optimal pricing through iterative tests, the next step is to apply regional pricing best practices to adapt these findings. Instead of relying solely on straightforward currency conversions, use test data to adjust prices based on local purchasing power and market conditions.
Mirava simplifies this process by using Willingness-To-Pay (WTP) algorithms and Purchasing Power Parity (PPP) to fine-tune regional pricing strategies. Additionally, aligning prices with locally preferred price endings - like .99, .00, or .95 - can help build consumer trust and improve conversion rates [2].
| Outcome | Meaning | Recommended Action |
|---|---|---|
| Variant [X] performed best | Statistically significant increase in revenue | Apply variant [X] immediately |
| Control performed best | Current price points are already optimized | Maintain current pricing; no changes needed |
| Inconclusive result | Test duration ended without significance | Run a new test with fewer variants or expand to more countries |
| Same performance | No meaningful difference between variant and control | Retain the control pricing or test a more aggressive adjustment |
Source: [4]
On Google Play, applying a winning price variant affects all countries included in the experiment. If no action is taken, prices will revert to the original control value 14 days after statistical significance is reached [4].
Tools for Better Pricing Decisions
Mirava: Pricing Intelligence Before Testing
Building a solid pricing strategy starts with understanding regional purchasing behavior. Mirava offers a platform that delivers data-driven insights into optimal pricing by analyzing purchasing power across more than 170 countries. Using proprietary indexes derived from data on platforms like Netflix, Spotify, Apple, and YouTube, Mirava provides tailored price recommendations rather than relying on basic currency conversions. By focusing on local spending power and specific price bands, it moves away from the outdated "one global price" model tied to USD. The platform consolidates all your regional pricing and product data into a single dashboard, allowing you to set minimum and maximum price thresholds to safeguard your margins. Additionally, Mirava keeps a record of price changes, currency shifts, and historical performance, ensuring you have a strong data foundation for any pricing tests [8].
After setting your pricing strategy, the next step is implementing it effectively with the right tools.
Partner Tools for Implementation
Once you've identified the best price points, implementation tools come into play. Platforms like RevenueCat, Adapty, Purchasely, and Superwall manage essential functions such as billing, paywalls, and user entitlements. These tools work seamlessly with Mirava by pulling price metadata directly from the App Store and Google Play Console. This integration ensures that when you adjust prices at the store level, the changes are automatically detected - no need for SDK updates or new app builds. This setup enables growth teams to take control of pricing experiments independently, reducing reliance on engineering resources and allowing for faster iterations across iOS, Android, and web platforms.
"Mirava updates prices at the store level. Tools like RevenueCat and Adapty read those changes automatically, so your paywalls, trials and entitlement logic stay exactly as they are." - Mirava [9]
Connecting Pricing and Implementation Tools
The combination of pricing insights from Mirava and advanced billing platforms creates a streamlined pricing workflow. Mirava identifies what to charge and where, while tools like RevenueCat and Adapty handle the operational side, including transactions and paywall displays. Since Mirava updates prices directly at the store level, these billing tools automatically sync the new data, eliminating the need for manual uploads or engineering-heavy processes. This integrated approach allows product and finance teams to run and measure mobile app pricing experiments quickly and efficiently, all without requiring new app versions to be shipped. It simplifies the entire pricing experimentation process, saving time and resources.
Conclusion
Key Benefits of Price Testing
A/B testing offers a reliable way to balance conversion rates with long-term revenue by isolating the impact of price changes from external factors like seasonal trends or marketing campaigns. This approach eliminates uncertainty and allows for data-driven decisions. The focus should be on Lifetime Value (LTV) rather than just initial conversion rates. While a lower price might attract more sign-ups, it could ultimately reduce revenue if those users churn quickly or contribute less over time. Regional pricing plays a critical role here; many apps miss revenue opportunities by either overpricing or underpricing in specific markets due to limited understanding of local purchasing power.
Beyond just tracking initial conversions, testing provides insights into churn, renewals, and refunds, offering a more comprehensive view of revenue impact. For instance, RevenueCat's case study on Pixelcut highlights how testing paywall variations led to a 16% increase in subscribers by focusing on full-funnel impact data [3].
These advantages lay the groundwork for refining and implementing a more effective pricing strategy.
Next Steps
To build on these insights, follow these steps to refine your pricing approach. Start by segmenting tests by geography to account for differences in market dynamics, exchange rates, and purchasing power [1]. Run separate experiments for each region and wait for statistical significance before making decisions - Google Play experiments, for example, use a 90% confidence level by default. Declaring results prematurely is a common mistake that can lead to suboptimal pricing outcomes [4]. Once you identify a winning price, roll it out across all relevant markets and platforms to maximize revenue.
Remember, testing is not a one-and-done process. Markets evolve, and regular retesting is essential to stay ahead.
"Even when your test is statistically significant, it doesn't mean it will be a winner until the end of time. Your users will change; your traffic, product, and competition will change." - Jakub Chour, Head of Growth at HER [1]
Utilize upstream pricing insights from Mirava to determine price points that reflect local purchasing power. Then, rely on tools like RevenueCat, Adapty, Purchasely, or Superwall to manage billing and paywalls effectively. This combination of data-backed insights and seamless implementation allows for rapid testing of new strategies without requiring heavy involvement from engineering teams.
"Before Mirava, we avoided touching pricing because it felt like too much work. Now we test new strategies without worrying about spreadsheets or App Store rules." - Jordan Okafor, Head of Growth at LiftWell [2]
FAQs
How long should a price test run before I trust the result?
Price tests should generally run for a minimum of 24 to 48 hours to gather enough data for analysis. However, depending on factors like user traffic and external influences, a longer testing period may be necessary. Allowing adequate time helps ensure the results are more reliable and reduces the risk of short-term fluctuations skewing the outcomes.
What’s the best metric to pick a winning price: LTV, ARPPU, or conversion?
When deciding on the best metric, it all comes down to your specific goals. If you're aiming for long-term revenue growth, metrics like ARPPU (Average Revenue Per Paying User) or LTV (Lifetime Value) are key. On the other hand, if you're looking to measure immediate user engagement, the conversion rate can provide quick feedback on user behavior. Tools like RevenueCat and Mirava suggest combining these metrics to create a well-rounded view that aligns with your app’s overall strategy.
How do I A/B test prices without confusing or upsetting existing subscribers?
To keep your current subscribers unaffected during A/B price testing, focus on controlled experiments within targeted segments instead of making sweeping changes. Leverage tools like RevenueCat to override default subscription options or display custom paywalls to specific user groups. This approach allows you to test pricing strategies on select audiences, ensuring you collect actionable insights without disrupting the experience for your existing subscriber base.